
Unlocking UX Success: The Power of the Right Questions
Understanding your users is crucial for creating exceptional user experiences. This listicle provides seven key survey questions for user experience, giving you the tools to gather actionable insights and improve your digital products. Learn how to leverage metrics like Net Promoter Score (NPS), System Usability Scale (SUS), Customer Effort Score (CES), Single Ease Question (SEQ), User Experience Questionnaire (UEQ), open-ended satisfaction questions, and task success rate questions. These questions help identify pain points and create products that resonate with your audience. Transform user feedback into improvements and build exceptional UX.
1. Net Promoter Score (NPS)
The Net Promoter Score (NPS) is a crucial metric for gauging user experience (UX) and predicting business growth. It's a simple, yet powerful, way to understand how likely your users are to recommend your product or service to others. This single-question survey utilizes a 0-10 scale, where 0 represents "not at all likely" and 10 signifies "extremely likely" to recommend. Based on their responses, users are categorized into three groups: Promoters (9-10), Passives (7-8), and Detractors (0-6). Your final NPS is calculated by subtracting the percentage of Detractors from the percentage of Promoters, resulting in a score between -100 and 100. A higher score indicates a greater likelihood of recommendations and, consequently, stronger customer loyalty and potential for growth.
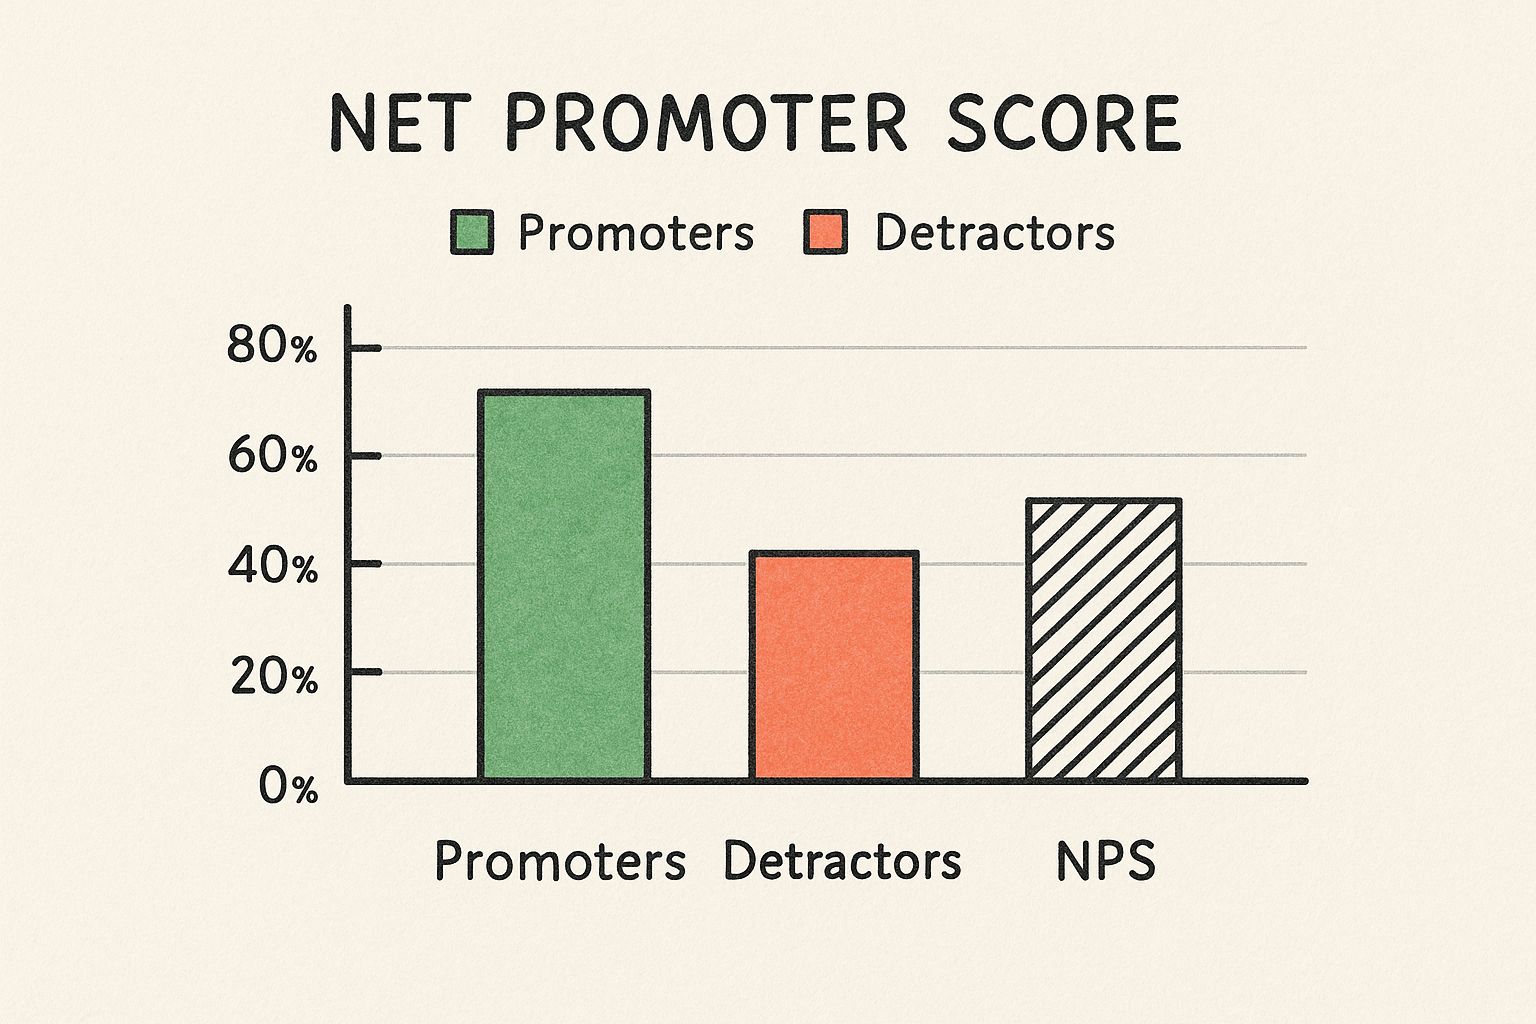
The infographic above visualizes the NPS calculation and its interpretation. For example, if you surveyed 100 users and 60 were Promoters, 30 were Passives, and 10 were Detractors, your NPS would be 50 (60% – 10%). The visual representation clearly demonstrates how the distribution of Promoters, Passives, and Detractors influences the final score. As the percentage of Promoters grows, the NPS score shifts towards the positive end of the spectrum, indicating a healthier and more recommendable user experience.
This method deserves a top spot in any list of survey questions for user experience due to its simplicity and effectiveness. Its single-question format minimizes survey fatigue, making it quick and easy for users to complete. This streamlined approach also simplifies analysis and allows for easy tracking of trends over time. The standardized nature of the NPS allows for benchmarking against competitors and industry standards. Companies like Apple, Airbnb, and Slack regularly leverage NPS to understand customer satisfaction and identify areas for improvement. Apple uses it across its product line, Airbnb implements it after stays to evaluate host and platform performance, and Slack uses NPS to track user satisfaction with their communication platform.
Features:
- Simple, single-question format with follow-up for explanation
- Uses a 0-10 scale for quantitative measurement
- Provides a standardized metric that can be tracked over time
- Easy to benchmark against industry standards
Pros:
- Quick for users to complete, minimizing survey fatigue
- Simple to analyze and track trends over time
- Widely recognized across industries, making benchmarking possible
- Can predict business growth and customer loyalty
Cons:
- Doesn't provide specific insights about what to improve
- Cultural bias in how different regions respond to numerical scales
- May oversimplify complex user experiences
- Requires follow-up questions to gain actionable insights
Tips for effective NPS implementation:
- Always include a follow-up "Why did you give this rating?" question. This open-ended question provides qualitative data that reveals the reasons behind the score and offers specific insights for improvement.
- Track NPS over time rather than focusing on a single measurement. This allows you to identify trends and evaluate the impact of changes you implement.
- Segment NPS results by user type, region, or product version. This helps pinpoint specific areas of strength and weakness within different user groups.
- Combine NPS with more detailed UX metrics for comprehensive insights. While NPS provides a valuable overview, combining it with other metrics like task completion rate and system usability scale (SUS) offers a more holistic view of the user experience.
The NPS was popularized by Fred Reichheld, creator of the NPS system, along with Bain & Company and Satmetrix, the consulting firms that developed the methodology. While no single website definitively "owns" NPS, searching for "Net Promoter Score" will provide numerous resources and tools. By understanding and implementing NPS effectively, you can gain valuable insights into user sentiment, identify areas for improvement, and ultimately enhance the overall user experience.
2. System Usability Scale (SUS)
The System Usability Scale (SUS) is a widely recognized and highly effective tool for gathering quick feedback on the usability of a system. Developed in 1986 by John Brooke, this 10-item questionnaire uses a 5-point Likert scale (ranging from "Strongly Disagree" to "Strongly Agree") to gauge users' perceptions of a system's ease of use and efficiency. It's remarkably versatile and can be applied to anything from websites and mobile apps to hardware and software, making it a valuable asset for evaluating user experience across diverse platforms. The SUS generates a score between 0 and 100, with higher scores indicating better usability. Generally, scores above 68 are considered above average, and scores above 80 suggest excellent usability. This allows for straightforward comparisons across different iterations of a product or even between competing products.
The SUS stands out for its standardized set of 10 questions, cleverly alternating between positive and negative statements to minimize response bias. This concise format allows for quick administration, typically taking users around 3 minutes to complete. This brevity is particularly beneficial for busy users and allows for larger sample sizes. The output of the SUS is a single, easily interpretable score, facilitating clear communication of usability findings to stakeholders. This score also allows for comparison against established benchmarks, providing valuable context for your results. Companies like Google, Microsoft, and even the UK Government Digital Service leverage the SUS to track usability improvements, benchmark against competitors, and evaluate public-facing services, showcasing its wide acceptance and applicability.
Features:
- 10 standardized questions (alternating positive and negative phrasing)
- 5-point Likert scale ("Strongly Disagree" to "Strongly Agree")
- Technology-agnostic design (suitable for various platforms)
- Generates a single, comparable score (0-100)
Pros:
- Reliable results with relatively small sample sizes (8-12 users)
- Valid for comparing usability across iterations or products
- Quick to administer (approximately 3 minutes)
- Extensive benchmarking data available
Cons:
- Doesn't pinpoint specific usability problems
- Scoring system can be complex
- Requires careful translation for international use
- Some questions might confuse users
Tips for Effective Use:
- Maintain Integrity: Don't modify the standard questions to ensure valid benchmarking.
- Dig Deeper: Include open-ended follow-up questions in your survey questions for user experience to identify specific usability issues.
- Simplify Communication: Present the final SUS score using adjective ratings (e.g., Poor, Good, Excellent) for stakeholders.
- Adequate Sample Size: Test with at least 5 users, aiming for 12-15 for more reliable results.
When to Use SUS:
The SUS is ideal for anyone needing a quick, reliable measure of overall system usability. Whether you're a freelancer iterating on a website design, a marketing team evaluating a new landing page, or a product manager assessing a software application, the SUS provides valuable insights. It’s particularly useful during iterative design processes, allowing you to track usability improvements over time. For a deeper dive into form design best practices and how SUS fits into the larger picture of user experience, Learn more about System Usability Scale (SUS).
The SUS deserves its place in this list because it provides a time-tested, standardized, and quantifiable method for assessing user experience. Its simplicity, versatility, and the availability of extensive benchmark data make it an invaluable tool for anyone involved in creating user-centered products and services.
3. Customer Effort Score (CES)
When crafting effective survey questions for user experience, understanding the effort users exert is crucial. The Customer Effort Score (CES) measures precisely this – how much effort a customer expends to use a product, resolve an issue, or complete a task. This metric centers around the principle that minimizing customer effort is a more effective driver of loyalty than exceeding expectations. Typically, CES employs a 7-point scale, asking users how strongly they agree with statements like, "The company made it easy for me to handle my issue." This focus on effort, rather than mere satisfaction, provides valuable insights into pain points within the user journey.
CES surveys can be implemented in various ways. They can be targeted to assess the effort required for specific tasks (e.g., completing a purchase, navigating a website) or gauge the overall interaction with a product or service. Often, CES questions are followed up with open-ended inquiries to pinpoint the specific touchpoints contributing to high-effort experiences. This allows businesses to directly address the root causes of friction.
Why CES Deserves a Place in Your UX Survey Toolkit:
CES offers several advantages over traditional satisfaction metrics. Its focus on quantifiable effort makes it a strong predictor of customer loyalty and repeat business. By identifying friction points in user journeys, CES provides actionable insights that help prioritize UX improvements and ultimately reduce customer frustration. For freelancers, solopreneurs, and businesses alike, understanding and minimizing customer effort is key to building a loyal customer base and driving sustainable growth.
Features and Benefits:
- Focus on Effort: Unlike traditional satisfaction surveys, CES zeroes in on the effort required, offering a more concrete measure of user experience.
- Actionable Insights: Pinpointing high-effort areas allows for targeted UX improvements and efficient resource allocation.
- Predictive Power: CES is a strong indicator of future customer behavior, particularly loyalty and repeat business.
- Flexibility: CES can be applied to specific tasks or broader interactions, offering versatility for different research needs.
Pros:
- Strong predictor of customer loyalty and repeat business
- Identifies friction points in user journeys
- More actionable than general satisfaction scores
- Helps prioritize UX improvements that reduce frustration
Cons:
- Doesn't capture the emotional or delight aspects of the experience.
- May not be appropriate for first-time or infrequent users.
- Less standardized than NPS or SUS, leading to varied implementations.
- Focuses on problems rather than opportunities for innovation.
Examples of Successful Implementation:
- Amazon: Uses CES to measure the efficiency of its checkout and return processes.
- Zappos: Tracks CES for customer service interactions to optimize support workflows.
- Intuit: Applies CES to measure the simplicity of tax filing within TurboTax.
Actionable Tips:
- Timely Deployment: Deploy CES surveys immediately after specific interactions for the most accurate and relevant feedback.
- Qualitative Follow-up: Combine CES with qualitative research (e.g., open-ended questions, user interviews) to understand the "why" behind high effort scores.
- Segmentation: Segment CES results by user type, task complexity, and channel to identify specific areas for improvement.
- CES 2.0: Consider using the updated CES 2.0 question: "To what extent do you agree with the statement: The company made it easy for me to handle my issue."
By incorporating CES into your user experience survey strategy, you can gain valuable insights into customer effort, identify areas for improvement, and ultimately create a smoother, more effortless experience that fosters loyalty and drives business growth. This is particularly important for freelancers and solopreneurs who rely heavily on positive customer experiences for referrals and repeat business. While CES doesn't capture every nuance of user experience, its targeted focus on effort makes it a powerful tool for identifying and addressing critical pain points within the user journey.
4. Single Ease Question (SEQ)
The Single Ease Question (SEQ) is a highly effective method for gathering user experience feedback, particularly when assessing the usability of specific tasks. It's a post-task metric that asks users to rate the difficulty of completing a task on a 7-point scale, ranging from "Very Difficult" to "Very Easy." Its simplicity makes it ideal for integrating into usability testing, task-based evaluations, and even live website environments. The SEQ provides a quick pulse check on user experience, allowing you to pinpoint friction points within your product or service. This makes it an invaluable tool for freelancers, solopreneurs, marketing teams, and anyone seeking to improve their user experience and boost conversions.
One of the key features of the SEQ is its task-specific focus. By administering the question immediately after a user completes a task, you gain granular feedback on that particular interaction. This is especially useful in multi-task studies, allowing you to compare the perceived difficulty of different tasks and identify areas for improvement. The 7-point scale offers sufficient granularity to detect subtle usability differences, while the single-question format minimizes interruption to the user flow. This concise approach reduces cognitive load for participants, resulting in higher response rates and more reliable data.
The SEQ has several advantages when it comes to evaluating user experience. It’s extremely quick to administer and analyze, making it a time-efficient method for collecting user feedback. It's also sensitive to usability differences between tasks, providing valuable insights into which aspects of your product or service are causing users difficulty. Furthermore, SEQ scores correlate well with other key metrics like task completion rates and time-on-task, providing a comprehensive view of usability.
However, the SEQ is not without its limitations. While it effectively identifies usability problems, it provides no diagnostic information about why something was difficult. This is why following up with an open-ended question like "Why did you give that rating?" is crucial. This additional context helps you understand the reasons behind the user's score and pinpoint specific areas for improvement. Another limitation is its susceptibility to recency bias, where users may overweigh their final interactions when giving a rating. Lastly, while valuable, the SEQ is less comprehensive than multi-question scales. Therefore, consider it a component of a larger UX measurement strategy.
Companies like Google, USAA, and IBM utilize the SEQ in their usability testing processes, demonstrating its effectiveness in diverse contexts. Google uses it during usability testing of new features, while USAA implements it after key customer journeys in their banking app. IBM incorporates SEQ in their enterprise software usability testing, further showcasing its versatility.
To effectively utilize the SEQ in your own user experience research, consider the following tips:
- Always follow up with "Why did you give that rating?" This open-ended question provides essential context and helps you understand the reasoning behind the user's score.
- Use consistently across tasks to enable valid comparisons. Consistency is key for identifying trends and making meaningful comparisons between different tasks or iterations of a design.
- Consider SEQ as a component of a larger UX measurement strategy. Combine SEQ with other usability metrics and qualitative feedback to gain a holistic understanding of the user experience.
- Pair with objective metrics like task success and time-on-task. This combination provides a more complete picture of usability, combining subjective user perception with quantifiable performance data.
By incorporating the Single Ease Question into your survey questions for user experience, you can gain valuable insights into the usability of your product or service, identify pain points, and ultimately create a better experience for your users.
5. User Experience Questionnaire (UEQ)
The User Experience Questionnaire (UEQ) is a powerful tool in your arsenal of survey questions for user experience, offering a standardized and validated approach to measuring the user experience of interactive products. Unlike simpler methods that might focus solely on usability, the UEQ delves into both the pragmatic and hedonic qualities of the experience. This means you gain insights not only into how easy and efficient the product is to use (pragmatic), but also how stimulating, engaging, and aesthetically pleasing it is (hedonic). This holistic approach makes it particularly valuable for understanding the overall user perception and satisfaction.
The UEQ employs a semantic differential format, presenting users with 26 pairs of opposing adjectives (e.g., attractive-unattractive, clear-confusing, innovative-conservative) and asking them to rate their experience on a 7-point scale for each pair. These responses are then used to calculate scores across six key dimensions of user experience:
- Attractiveness: How visually appealing and pleasant is the product?
- Perspicuity: How clear and understandable is the product's structure and functionality?
- Efficiency: How quickly and easily can users achieve their goals?
- Dependability: How reliable and trustworthy is the product?
- Stimulation: How exciting and engaging is the experience?
- Novelty: How original and innovative is the product?
Why the UEQ Deserves its Place on this List:
The UEQ's strength lies in its comprehensive coverage of both practical usability and the often-overlooked emotional aspects of the user experience. This makes it a valuable tool for identifying areas for improvement that might be missed by more basic usability testing methods. Its robust statistical validation and the availability of a benchmark dataset further enhance its credibility and allow you to compare your product's performance against industry averages. This is particularly beneficial when making strategic design decisions and demonstrating the value of UX improvements to stakeholders.
Examples of Successful Implementation:
Organizations like SAP use the UEQ to evaluate the user experience of complex enterprise software interfaces, while Mozilla has applied it to assess the impact of Firefox browser redesigns. Even automotive manufacturers leverage the UEQ to evaluate the usability and appeal of in-vehicle information systems. These examples demonstrate its versatility across various industries and product types.
Actionable Tips for Using the UEQ:
- Use the official UEQ Data Analysis Tool: This tool is essential for proper scoring, visualization, and benchmarking of your results. You can find it on the official UEQ website (https://www.ueq-online.org/).
- Consider the UEQ-S for quicker assessments: If you're constrained by time, the shorter UEQ-S (8 items) offers a more concise evaluation while still capturing key aspects of the user experience.
- Maintain the randomized order of items: Adhere to the official questionnaire structure to ensure the validity and reliability of your results.
- Combine with task-based metrics: While the UEQ provides valuable subjective data, consider complementing it with objective metrics from task-based usability testing for a more comprehensive understanding of user behavior.
Pros:
- Comprehensive coverage of pragmatic and hedonic qualities.
- Strong statistical validation and benchmark data available.
- Reveals emotional and aesthetic aspects often missed by other methods.
Cons:
- Relatively long completion time (3-5 minutes).
- Some terminology may be confusing to users.
- Complex analysis compared to simpler metrics.
- May be overkill for simple or focused evaluations.
When you need a thorough understanding of the user experience that goes beyond simple usability, the UEQ provides the depth and rigor necessary for informed decision-making. Its ability to capture both the functional and emotional responses of users makes it an invaluable tool for anyone seeking to create truly engaging and satisfying user experiences. This makes the UEQ a crucial addition to any UX professional's toolkit for gathering insightful survey questions for user experience research.
6. Open-Ended Satisfaction Question
Open-ended satisfaction questions are invaluable tools in the arsenal of any UX researcher looking to gather in-depth feedback. Unlike multiple-choice or rating-scale questions, these qualitative survey questions for user experience empower users to articulate their experiences in their own words. This unstructured format opens a window into the user's mind, providing rich, contextual feedback that can uncover unanticipated issues and opportunities for improvement. Essentially, they give users the freedom to highlight what matters most to them, making them a crucial element for creating truly user-centered designs. Learn more about Open-Ended Satisfaction Question
Typically phrased as "What did you like most/least about your experience?" or "How could we improve our product?", open-ended satisfaction questions delve deeper than quantitative metrics. Instead of simply measuring how satisfied a user is, they explore why. This is particularly helpful for freelancers, solopreneurs, marketing teams, and anyone seeking to deeply understand their target audience and tailor their products or services accordingly. For researchers and educators, the qualitative data gleaned from these questions can enrich studies and provide valuable insights.
Features and Benefits:
- Unstructured format: Allows for unexpected insights and uncovers issues designers may not have anticipated.
- Flexibility: Can be general ("How was your overall experience?") or focused on specific aspects ("What did you think of the checkout process?").
- Voice-of-customer data: Provides rich verbatims that can be used for stakeholder communication, bringing the user's perspective to life.
- Emotional insight: Often reveals emotional reactions and underlying motivations that aren't captured in simple ratings.
Pros:
- Discovers the unknown: Surfaces issues and opportunities that might be missed with structured questions.
- Rich context: Provides detailed feedback and specific suggestions for improvement.
- User language: Captures user terminology and phrasing, which can be used to improve messaging and content.
- Prioritization: Helps prioritize improvements based on the frequency of mentions and the intensity of user sentiment.
Cons:
- Analysis intensive: Time-consuming to analyze, especially at scale. For larger datasets, consider using text analysis tools or tagging systems.
- Response bias: Prone to response bias, as extremely satisfied or dissatisfied users are more likely to respond.
- Difficult to quantify: Challenging to quantify or track trends over time without additional analysis.
- Interpretation required: Requires skilled interpretation to identify patterns and extract meaningful insights.
Examples of Successful Implementation:
- Airbnb: Asks "How could your host have improved your stay?" after each booking, gathering specific feedback to improve host performance and guest satisfaction.
- Spotify: Uses "What would make Spotify better for you?" in quarterly surveys to understand user needs and inform product development.
- Slack: Implements "What's holding you back from using Slack more?" for less active users, identifying friction points and potential areas for improvement to increase engagement.
Actionable Tips:
- Neutral wording: Use neutral wording to avoid leading questions and ensure unbiased responses.
- Balanced approach: Combine positive and negative questions (e.g., "What did you like most? What did you like least?") to get a well-rounded perspective.
- Text analysis: For large-scale surveys, utilize text analysis software or tagging systems to streamline analysis and identify recurring themes.
- Share verbatims: When reporting to stakeholders, quote compelling verbatims to illustrate key findings and bring the user's voice to the forefront.
- Focus questions: Consider asking "What one thing would you improve?" to encourage focused feedback and simplify analysis.
Open-ended satisfaction questions deserve a place in any UX research toolkit because they provide a direct line to the user's perspective. By understanding the "why" behind user satisfaction, designers, marketers, and product managers can make informed decisions that lead to improved user experiences and ultimately, greater success. They are particularly valuable for event planners or HR professionals gathering feedback, as well as sales teams looking for deeper insights into customer needs. This approach, popularized by UX thought leaders like Jakob Nielsen and Jared Spool, champions qualitative user feedback as a cornerstone of human-centered design. This methodology has also been instrumental in the success of design firms like IDEO, known for their human-centered, qualitative research methods.
7. Task Success Rate Question
Task success rate is a crucial metric for understanding how well your product's user experience (UX) enables users to achieve their goals. This type of survey question, a cornerstone in usability testing and UX research, focuses specifically on whether users can complete a defined task within your product or service. Including task success rate questions in your survey repertoire is essential for optimizing user journeys and identifying pain points within your design. This question type deserves its place on this list of survey questions for user experience due to its direct connection to core usability principles and its ability to provide clear, actionable data.
This method involves asking users whether they were able to complete a specific action. The question is typically phrased as "Were you able to complete [specific task]?" and offers binary (yes/no) response options or a confidence rating scale (e.g., 1-5 or 1-7 where 1 represents "Not at all confident" and 5 or 7 represents "Very confident"). Tracking task success is critical for measuring the effectiveness of your UX design and directly correlates with user satisfaction. It can be measured through self-reporting within a survey or observed directly by researchers during moderated usability testing.
How it Works:
The task success rate question focuses on individual tasks rather than gauging the overall user experience. For example, instead of asking “How satisfied are you with the website?”, you might ask "Were you able to successfully book a hotel room?" This task-specific approach provides granular insights into usability issues related to distinct user flows. Often, time-on-task measurements are also collected to assess efficiency, and a follow-up question regarding the user’s confidence level in completing the task can provide further nuance. Pairing task success rate with a difficulty rating (e.g., the Single Ease Question – SEQ) allows you to identify tasks that users can complete, but find challenging, offering valuable improvement opportunities.
Examples of Successful Implementation:
- Booking.com: Measures task success rates for reservation completion to ensure users can easily navigate the booking process.
- Adobe: Tracks success rates for key creative tasks within their design software to identify and address usability hurdles that impede creative workflows.
- Government Digital Services: Measure task completion rates for critical citizen services to ensure accessibility and ease of use for all users.
Actionable Tips:
- Define clear success criteria before measuring: Clearly define what constitutes successful task completion before conducting your survey or usability test. This ensures accurate data collection and analysis.
- Follow up with a confidence question: Asking "How confident are you that you completed this task successfully?" can reveal nuances in user perception and uncover potential issues even with successful completions.
- Track both success rate and time-on-task: Combining these metrics provides insights into both effectiveness (success rate) and efficiency (time-on-task).
- Segment results: Analyze task success rates based on user experience level, device type, demographics, or other relevant segments to pinpoint specific user needs and pain points.
- Prioritize improvements: Use task completion rates to prioritize which user journeys require immediate attention and redesign.
Pros:
- Directly measures core usability – whether users can accomplish their goals.
- Provides clear, objective data for tracking improvements.
- Easy to understand for all stakeholders.
- Helps identify critical failure points in user journeys.
Cons:
- Self-reported success may differ from actual success.
- Binary measure misses nuance of partial success.
- Doesn't capture efficiency or satisfaction dimensions on its own.
- Requires careful task definition to be meaningful.
When and Why to Use This Approach:
Use task success rate questions when you need to understand how effectively your product or service supports users in completing specific tasks. This is essential for:
- Usability Testing: Identify usability problems and areas for improvement.
- Benchmarking: Track progress and measure the impact of design changes.
- A/B Testing: Compare different design variations to determine which performs best.
- Monitoring Performance: Continuously monitor key tasks to ensure consistent usability.
By incorporating task success rate questions into your survey questions for user experience, you gain valuable insights into the effectiveness of your design and can make data-driven decisions to improve usability and user satisfaction. This approach, popularized by UX thought leaders like Jakob Nielsen, Jeff Sauro, and Steve Krug, is a fundamental part of a user-centered design process.
7 Survey Questions Comparison
| Survey Question | Implementation Complexity 🔄 | Resource Requirements 🔄 | Expected Outcomes 📊 | Ideal Use Cases 💡 | Key Advantages ⭐ |
|---|---|---|---|---|---|
| Net Promoter Score (NPS) | Low – single question, simple calculation | Minimal – quick survey, follow-up recommended | Standardized loyalty metric; tracks customer satisfaction trends | Benchmarking customer loyalty & business growth | Quick, widely recognized, easy to analyze and benchmark |
| System Usability Scale (SUS) | Moderate – 10 questions with specific scoring | Low to moderate – small sample size sufficient | Reliable usability score; facilitates comparisons across products | Quick usability assessment & iterative design | Reliable, tech-agnostic, extensive benchmarking data |
| Customer Effort Score (CES) | Low to moderate – single core question plus follow-ups | Low – short scale, task-specific deployment | Identifies friction points to improve customer loyalty | Measuring ease of task completion & support processes | Strong link to loyalty, more actionable than satisfaction scores |
| Single Ease Question (SEQ) | Very low – single question immediately after task | Minimal – task-based, quick to administer | Granular task difficulty rating sensitive to usability differences | Usability testing for task-specific feedback | Extremely quick, low participant burden, sensitive metric |
| User Experience Questionnaire (UEQ) | High – 26 pairs of opposing adjectives | Moderate – longer completion and analysis time | Comprehensive emotional and pragmatic UX assessment | Detailed UX research including hedonic aspects | Balanced pragmatic/hedonic measures, strong validation |
| Open-Ended Satisfaction Question | Low to moderate – unstructured responses require analysis | High – time-intensive qualitative analysis | Rich contextual insights, uncovers unexpected issues | Exploratory research, qualitative user feedback | Captures authentic user voice and context |
| Task Success Rate Question | Low – simple yes/no or confidence rating | Low – simple data collection, possibly observational | Clear binary usability measurement; identifies task failure points | Measuring task completion and critical process success | Direct, objective, easy to understand and communicate |
Turning Insights into Action: Building Better UX
Mastering the art of asking the right survey questions for user experience is paramount to creating products and services that not only meet but exceed user expectations. We've explored seven powerful tools in your UX arsenal: Net Promoter Score (NPS), System Usability Scale (SUS), Customer Effort Score (CES), Single Ease Question (SEQ), User Experience Questionnaire (UEQ), open-ended satisfaction questions, and task success rate questions. Each of these provides unique insights into different facets of the user journey, allowing you to paint a comprehensive picture of your users' experience. From understanding overall satisfaction to pinpointing specific pain points, these survey questions for user experience are invaluable for informed decision-making.
The key takeaway here is that gathering user feedback isn't just about collecting data; it's about transforming that data into actionable improvements. After gathering valuable user feedback through surveys, it's crucial to analyze the data and take actionable steps to improve the user experience. For further guidance on measuring and improving customer satisfaction, explore these helpful customer satisfaction measurement strategies from Hypertype. Whether you're a freelancer seeking to refine your offerings, a marketing team aiming to boost conversions, an event planner looking to improve attendee satisfaction, or an HR professional collecting employee feedback, understanding the user experience is crucial for success. By implementing these survey questions for user experience, you gain a competitive edge, fostering loyalty, and ultimately driving growth.
Empowering your users with a voice leads to products that truly resonate. Ready to streamline your UX research and build exceptional user experiences? BuildForm makes designing, distributing, and analyzing user experience surveys simple and efficient, allowing you to quickly turn insights into action. Start building better experiences today with BuildForm.