
Unlocking Insights: Choosing the Right Survey Questions
Want to create surveys that truly get results? Understanding the difference between qualitative vs quantitative survey questions is key. This listicle explores six common survey question types—from open-ended questions to dichotomous questions—clarifying their pros, cons, and ideal uses. Learn how to collect meaningful data, whether you need rich narratives or quantifiable metrics, and make smarter, data-driven decisions. This guide will help you choose the right questions for your specific needs, enabling you to gather actionable insights efficiently.
1. Open-Ended Questions
Open-ended questions are a cornerstone of qualitative research and play a crucial role when distinguishing between qualitative vs quantitative survey questions. They allow respondents to answer freely in their own words, providing rich, detailed insights and personal perspectives that often go undiscovered with structured, quantitative questions. Instead of pre-defined answer choices, open-ended questions invite narrative, textual data that sheds light on the "why" behind respondent behaviors and opinions, making them essential for exploratory research. This approach is invaluable for understanding complex issues and gaining a deeper understanding of your target audience.
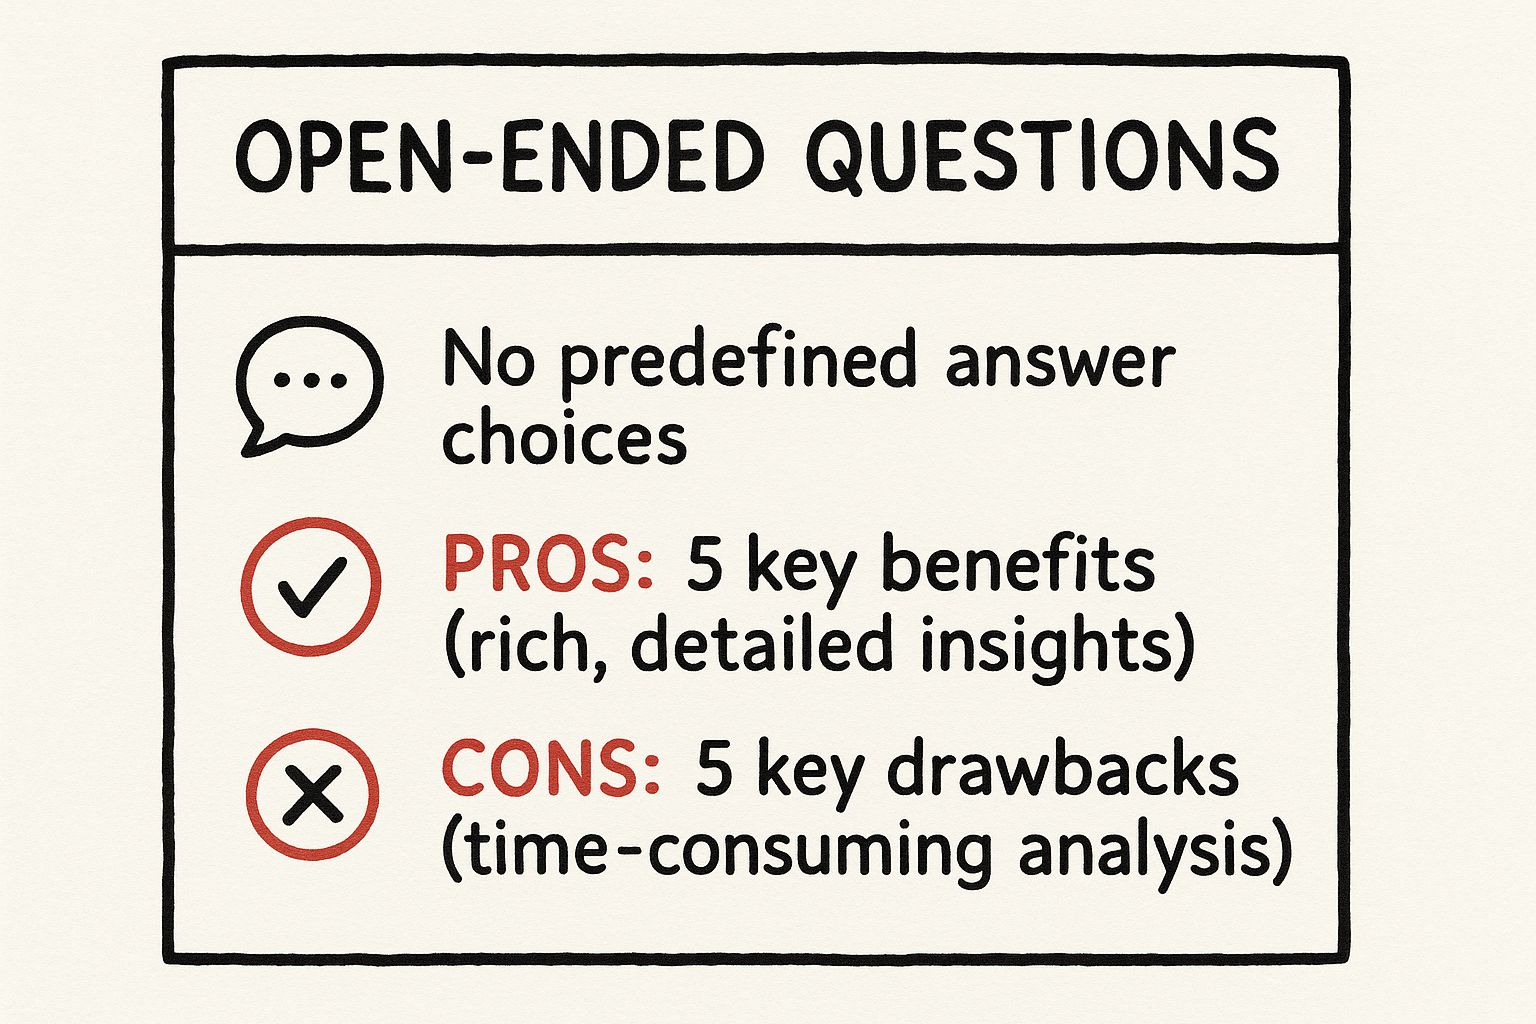
The infographic above provides a quick reference for the key aspects of open-ended questions. It highlights their qualitative nature, the type of data they collect (textual), common starting words (how, what, why, describe), and the need for subsequent coding or thematic analysis. This visual summary emphasizes the core value proposition of open-ended questions: obtaining rich, qualitative insights.
Open-ended questions typically begin with "how," "what," "why," or "describe," prompting respondents to elaborate and express themselves fully. Examples include: "How do you feel about our customer service?", "What factors influenced your purchasing decision?", "Why did you choose our product over competitors?", and "Describe your ideal shopping experience." These types of questions are particularly powerful in uncovering unexpected information and capturing nuanced opinions and feelings that multiple-choice questions often miss.
Here's a quick reference summarizing key data about open-ended questions:
- Type: Qualitative
- Data Collected: Narrative, Textual
- Starting Words: How, What, Why, Describe
- Analysis: Coding/Thematic Analysis
This summary reinforces the importance of coding and thematic analysis in processing the rich data gathered from open-ended questions, a point we'll explore further.
The video above further illustrates the application of open-ended questions.
While the benefits are substantial, it's important to acknowledge the challenges. Open-ended questions are time-consuming to analyze, often requiring manual coding or thematic analysis, especially with larger datasets. They are also subject to interpretation bias and can lead to lower completion rates due to the increased effort required from respondents. Furthermore, quantifying and comparing responses can be difficult.
Pros:
- Provides rich, detailed insights
- Discovers unexpected information
- Allows for personal expression
- Ideal for exploratory research
- Captures nuanced opinions and feelings
Cons:
- Time-consuming to analyze
- Subject to interpretation bias
- Lower completion rates due to higher effort
- Difficult to quantify or compare across respondents
- Requires more respondent effort
Tips for Effective Use:
- Keep questions clear and specific: Avoid ambiguity to ensure relevant responses.
- Use when depth is more important than breadth: Prioritize open-ended questions when you need in-depth understanding.
- Limit the number of open-ended questions: Too many can overwhelm respondents and decrease completion rates.
- Consider text analysis software for larger data sets: Tools like NVivo or Atlas.ti can assist with coding and analysis.
- Use probing follow-ups like "Please explain why": Encourage respondents to provide further detail.
Open-ended questions deserve their place in this list because they provide invaluable qualitative data, allowing researchers and businesses to deeply understand customer experiences, motivations, and needs. They are particularly useful for freelancers, solopreneurs, marketing teams, event planners, HR professionals, researchers, and educators who need rich insights to improve their products, services, or understanding of their target audience. Popularized by qualitative researchers like Robert Yin and utilized by market research firms like Nielsen and user experience researchers at companies like IDEO, open-ended questions have become a vital tool for gathering in-depth information. Learn more about Open-Ended Questions to understand their application in user experience research.
2. Multiple Choice Questions
Multiple choice questions are a cornerstone of quantitative surveys, providing a structured and efficient way to gather data from respondents. They present a predefined set of answer options, allowing participants to select one or more choices depending on the question format (single-select or multi-select). This method yields standardized, categorical data that's easy to analyze statistically and compare across large sample sizes, making it ideal for identifying trends and patterns. This makes them invaluable when exploring the "qualitative vs quantitative survey questions" landscape, firmly placing them in the quantitative category. Their structured nature allows for efficient analysis and comparison, a key differentiator when considering qualitative vs quantitative survey questions.

Multiple choice questions are particularly useful for gathering demographic information, understanding preferences, and measuring satisfaction levels. For example, a business might use a multiple choice question to ask about customer satisfaction with a product, offering options like "Very Satisfied," "Satisfied," "Neutral," "Dissatisfied," and "Very Dissatisfied." This structured approach allows for easy quantification and comparison of satisfaction levels across different customer segments.
Features:
- Predefined answer choices: This provides a clear framework for respondent answers.
- Single-select or multi-select: Offers flexibility in question design, accommodating different data needs.
- Standardized, categorical data: Facilitates statistical analysis and reporting.
- Easy to analyze statistically: Enables efficient data processing and identification of trends.
- "Other" option with text field: Allows for capturing responses outside the predefined options, adding a qualitative element.
Pros:
- Quick and easy for respondents: Minimizes respondent burden and encourages higher completion rates.
- Consistent, structured data: Simplifies analysis and comparison across responses.
- Easy to analyze and quantify: Enables efficient data processing and reporting.
- Reduces ambiguity in responses: Provides clear options, minimizing misinterpretations.
- Enables direct comparisons between respondents: Facilitates identification of patterns and trends.
Cons:
- May miss unexpected insights: Predefined options may limit the discovery of unanticipated perspectives.
- Can introduce bias through answer choices: Careful question design is crucial to avoid leading respondents towards specific answers.
- Limited depth of information: May not capture the nuances of respondent opinions or experiences.
- Respondents may feel forced into inappropriate choices: The "Other" option helps mitigate this, but careful consideration of options is essential.
- Requires thorough advance knowledge to create good options: Effective multiple choice questions require careful planning and understanding of the target audience.
Examples:
- "Which of our products do you use? (Select all that apply)"
- "How did you hear about our company? (Select one)"
- "Which features are most important to you? (Select up to three)"
Tips for Effective Multiple Choice Questions:
- Ensure options are mutually exclusive (when appropriate): Avoid overlapping categories that could lead to confusion.
- Make options collectively exhaustive: Provide options that cover all possible responses.
- Consider adding an "Other" option with a text field: Allow respondents to provide additional information or insights not captured by the predefined choices.
- Randomize answer choices (to prevent order bias): This ensures that the order of options doesn't influence respondent selections.
- Keep the list of options manageable (ideally 7 or fewer): Long lists can overwhelm respondents and reduce response quality.
Multiple choice questions are a powerful tool for collecting quantitative data in a structured and efficient manner. By understanding their features, benefits, and limitations, researchers, marketers, and other professionals can leverage them effectively to gather valuable insights and make data-driven decisions. When weighing qualitative vs quantitative survey questions, multiple choice questions are a go-to for quantifiable data that allows for easy analysis and comparison. They are particularly well-suited for freelancers, solopreneurs, marketing teams, event planners, HR professionals, and researchers seeking scalable and efficient data collection methods. Pioneered by figures like Rensis Likert and Arthur Nielsen, and popularized by platforms like SurveyMonkey and Qualtrics, multiple choice questions remain a staple in survey design.
3. Likert Scale Questions
When exploring the differences between qualitative vs quantitative survey questions, Likert Scale questions stand out as a powerful tool for quantifying subjective opinions. Developed by Rensis Likert in 1932 and later popularized by figures like Robert Kahn and organizations like the American Customer Satisfaction Index (ACSI), these questions offer a structured approach to measuring attitudes and opinions. They achieve this by presenting respondents with a symmetric agree-disagree scale, typically ranging from 5 to 7 points, allowing them to indicate the intensity of their feelings toward a particular statement. This makes them a valuable asset in quantitative research.
Likert scales work by providing a predefined set of response options that represent varying degrees of agreement or disagreement with a given statement. This structured format transforms subjective feelings into quantifiable data, enabling more sophisticated statistical analysis. For instance, instead of simply asking if a customer is happy, a Likert scale question might ask, "How satisfied are you with the product quality?" with options ranging from "Strongly Disagree" to "Strongly Agree."
Features of Likert Scale Questions:
- Symmetric Scale: The scale is balanced, with equal gradations on both sides of a neutral midpoint (if an odd number of points is used).
- Typical Points: While 5 or 7 points are most common, scales can also utilize 4 or 10 points depending on the level of nuance desired.
- Intensity Measurement: Captures the strength of respondents' feelings, providing more granular data than simple binary choices.
- Interval Data Analysis: Allows for more robust statistical analysis, enabling researchers to calculate means, standard deviations, and perform correlations.
- Batteries of Items: Often grouped together to assess multiple facets of a broader construct, like customer satisfaction.
Pros:
- Easy to Understand: Respondents can quickly grasp the concept and provide their input.
- Quantifiable Opinions: Transforms subjective feelings into numerical data, enabling statistical analysis.
- Sophisticated Analysis: Facilitates advanced statistical techniques, revealing deeper insights.
- Longitudinal Studies: Effective for measuring changes in attitudes or opinions over time.
- Nuanced Responses: Offers more than just "yes" or "no," capturing the intensity of feelings.
Cons:
- Central Tendency Bias: Respondents may gravitate towards the neutral midpoint, especially on sensitive topics.
- Acquiescence Bias: Some individuals tend to agree with statements regardless of their actual opinion.
- Cultural Differences: Interpretation of scale points can vary across cultures.
- Lack of Depth: While measuring intensity, Likert scales may not fully capture the reasons behind opinions.
- Limited by Statements: Responses are constrained by the predefined statements provided.
Examples:
- Satisfaction: "I am satisfied with the product quality." (Strongly disagree to Strongly agree)
- Agreement: "The customer service representative was helpful." (Strongly disagree to Strongly agree)
- Frequency: "How often do you use our mobile app?" (Never to Very frequently)
Tips for Effective Use:
- Consistency: Use the same scale throughout your survey to avoid confusion.
- Neutral Option: Consider whether a neutral midpoint is appropriate for your research question.
- Avoid Double-Barreled Questions: Each statement should address only one concept.
- Clear Labels: Label all points on the scale to ensure clear interpretation.
- Balanced Wording: Use neutral language in your statements to avoid leading respondents.
Likert scale questions are particularly useful for freelancers, solopreneurs, marketing teams, and researchers who need to gather quantifiable data on opinions and attitudes. They can be integrated seamlessly into lead capture forms, customer satisfaction surveys, and market research questionnaires. Whether you're tracking customer feedback, measuring employee engagement, or evaluating the success of a new product, Likert scales provide a versatile and reliable method for gaining valuable insights. Learn more about Likert Scale Questions This understanding of qualitative vs quantitative survey questions empowers you to choose the right tool for the job, ensuring your data collection efforts are effective and insightful.
4. Rating Scale Questions
Rating scale questions are a powerful tool in the quantitative side of the qualitative vs quantitative survey questions debate. They provide a structured way to gather quantifiable data about respondents' attitudes, opinions, and experiences. Essentially, these questions ask respondents to evaluate a specific attribute on a numerical scale, allowing for statistical analysis and comparison. This makes them particularly valuable for measuring customer satisfaction, product quality, or the likelihood of recommendations.
These scales typically range from 1-5, 1-7, or 1-10, with clearly labeled endpoints. For example, a scale might range from "1 – Very Dissatisfied" to "5 – Very Satisfied". Unlike Likert scales, which measure agreement with statements, rating scales directly measure the intensity of a feeling or evaluation about a particular subject. While both are quantitative, rating scales focus on direct measurement of a concept like satisfaction or quality, whereas Likert scales assess agreement with statements related to that concept. This directness contributes to their ease of use and interpretation. They can also utilize visual representations like stars (★☆☆☆☆ to ★★★★★) which can enhance respondent engagement.
Examples of Successful Implementation:
- Net Promoter Score (NPS): "On a scale from 1-10, how likely are you to recommend our service to a friend?" This widely used metric, popularized by Fred Reichheld, gauges customer loyalty and potential for growth.
- Product Quality: "Please rate the quality of our support: (1=Poor, 5=Excellent)" This provides a direct measure of customer perceived quality.
- Overall Experience: "How would you rate your overall experience? (★☆☆☆☆ to ★★★★★)" Star ratings are visually appealing and commonly used for online reviews and feedback.
Actionable Tips for Using Rating Scale Questions:
- Clearly label the endpoints of your scale: This ensures respondents understand the meaning of each number.
- Consider whether all points need labels: Sometimes labeling only the endpoints is sufficient, especially with shorter scales.
- Be consistent with scale direction: Maintain the same direction (e.g., low to high) throughout your survey for consistency.
- Choose the right scale length: Shorter scales (1-5) are simpler, while longer scales (1-10) offer greater granularity.
- Consider cultural differences in scale interpretation: Number meanings can vary across cultures, so adapt your scales accordingly.
Pros of Using Rating Scale Questions:
- Intuitive for respondents: Easy to understand and answer quickly.
- Provides granular measurement of attitudes: Captures subtle differences in opinion.
- Easy to analyze statistically: Provides quantifiable data for analysis and reporting.
- Ideal for benchmarking: Allows comparison against competitors or previous performance.
- Well-suited for tracking trends over time: Enables monitoring of changes in satisfaction or quality.
Cons of Using Rating Scale Questions:
- Different interpretations of numbers by respondents: Subjectivity can lead to variations in how individuals interpret the scale.
- Scale labels can influence responses: The wording of labels can bias responses towards a particular end of the scale.
- Doesn't explain reasoning behind ratings: Provides limited insight into the "why" behind the rating.
- Cultural differences in how scales are used: Cultural norms can influence how people respond to scales.
- Subject to response biases: Like all survey questions, rating scales can be influenced by biases such as central tendency bias (choosing the middle option).
Why Rating Scale Questions Deserve Their Place:
Rating scale questions bridge the gap between qualitative and quantitative data collection. They are essential for anyone seeking to gather measurable data on subjective experiences. Whether you're a freelancer assessing client satisfaction, a marketing team tracking product feedback, an event planner gauging event success, or an HR professional collecting employee feedback, rating scales provide valuable insights that can drive informed decision-making. They are particularly valuable for tracking trends and benchmarking progress, offering a concrete measure of key performance indicators. Their versatility and ease of use make them a fundamental tool for any researcher or business seeking to understand and improve their offerings.
5. Semantic Differential Questions
Semantic differential questions offer a robust way to gauge nuanced perceptions and attitudes within quantitative surveys. Unlike other quantitative methods like multiple-choice questions which offer limited pre-defined answers, semantic differential questions allow respondents to express their opinions on a sliding scale between two opposing adjectives. This makes them particularly valuable when exploring subjective experiences and emotional responses, bridging the gap between purely quantitative and qualitative data. Instead of measuring agreement or frequency, semantic differential scales capture the intensity of a respondent's perception along a particular dimension. This approach makes it an invaluable tool when distinguishing between similar options or understanding complex feelings towards a product, brand, or experience, effectively contributing to a more comprehensive understanding within the qualitative vs quantitative survey questions landscape.

Semantic differential scales typically utilize a 7-point scale, although 5-point scales can also be employed. Crucially, they don't include a neutral label, forcing respondents to lean one way or the other, even if only slightly. This subtle difference from Likert scales (which do include a neutral option) helps reveal stronger underlying sentiments. The respondent places a mark on the scale to indicate their perceived position between the two bipolar adjectives. For example, a respondent might rate a software product as being closer to "Intuitive" than "Complicated" on the scale.
Examples of Successful Implementation:
- Brand Perception: A company uses semantic differential scales to understand how consumers perceive their brand compared to competitors (e.g., "Modern" vs. "Outdated," "Trustworthy" vs. "Suspicious"). This data can then be used to refine branding and marketing strategies.
- Product Evaluation: A software company asks users to rate a new interface (e.g., "User-Friendly" vs. "Difficult," "Efficient" vs. "Cumbersome"). The feedback helps prioritize improvements and identify potential usability issues.
- Event Feedback: Event organizers use semantic differential questions to evaluate attendee satisfaction (e.g., "Organized" vs. "Chaotic," "Engaging" vs. "Boring"). This data informs future event planning and improvements.
Actionable Tips for Using Semantic Differential Questions:
- Choose Adjective Pairs Carefully: Select adjectives that are truly opposites and relevant to the topic. Avoid jargon or ambiguous terms.
- Randomize Positive/Negative Sides: Alternate which side of the scale presents the positive adjective to reduce response bias.
- Maintain Consistent Scale Direction: If possible, keep the direction of scales consistent (e.g., positive on the right) to avoid confusion.
- Group Related Concepts: Place related adjective pairs near each other for better flow and respondent comprehension.
- Limit the Number of Pairs: Too many scales can lead to respondent fatigue. Aim for 5-10 pairs per question set.
Pros of Using Semantic Differential Questions:
- Captures Nuanced Perceptions: Allows for a more granular understanding of attitudes than simple dichotomous choices.
- Reduces Acquiescence Bias: The forced-choice nature minimizes the tendency to simply agree with statements.
- Effective for Comparative Studies: Ideal for comparing different products, brands, or experiences.
- Measures Multiple Dimensions Efficiently: A single question can assess perceptions across several key attributes.
- Works Well for Visual/Spatial Perceptions: Suitable for evaluating aesthetics, design, and other visual elements.
Cons of Using Semantic Differential Questions:
- Requires Careful Selection of Adjective Pairs: Poorly chosen adjectives can lead to inaccurate or misleading results.
- Translation Challenges: Translating adjective pairs across languages while maintaining their intended meaning can be difficult.
- Potential for Confusion: Respondents may misinterpret adjectives or the scale itself if not clearly explained.
- Visual Clutter: Multiple scales can make the survey appear visually cluttered and overwhelming.
- Subjective Interpretation of Adjectives: Different respondents may interpret the same adjective in slightly different ways.
Semantic differential questions are a valuable addition to any researcher's toolkit. By carefully crafting these questions and considering the potential challenges, you can gain richer insights into the attitudes and perceptions of your target audience. This question type shines when exploring complex, subjective experiences, making it a crucial component when deciding between qualitative vs quantitative survey questions and ensuring your survey captures the full spectrum of respondent sentiment. They were popularized by Charles Osgood in the 1950s and continue to be a valuable method for understanding opinions and perceptions.
6. Dichotomous Questions
When deciding between qualitative vs quantitative survey questions, dichotomous questions represent a powerful tool in the quantitative arsenal. These questions offer a simple, binary choice between two options, usually "Yes/No," "True/False," or "Agree/Disagree." Their simplicity makes them incredibly efficient for gathering quantifiable data, especially in situations where nuance isn't the primary goal. This makes them particularly valuable for freelancers, solopreneurs, marketers, event planners, HR professionals, and researchers alike.
Dichotomous questions work by presenting respondents with a clear, unambiguous choice. This binary format produces nominal data, readily categorized and counted. This characteristic simplifies analysis and allows for quick segmentation of respondents based on their answers. For example, asking "Have you used our product before?" immediately divides your audience into users and non-users, providing valuable insights for targeted marketing efforts.
Features and Benefits:
- Binary response options: Typically "Yes/No," ensuring clarity and ease of response.
- Nominal data generation: Facilitates straightforward analysis and reporting.
- Rapid response time: Minimizes respondent burden and encourages higher completion rates.
- Effective screening tool: Quickly filters respondents based on specific criteria.
- Clear data segmentation: Allows for targeted analysis and action based on responses.
Examples of Successful Implementation:
- Market Research: "Are you interested in purchasing a new car in the next six months?" (Yes/No) This helps identify potential customers for targeted advertising campaigns.
- Event Planning: "Will you be attending the conference dinner?" (Yes/No) This allows for accurate catering and logistical arrangements.
- HR & Recruitment: "Do you have experience in project management?" (Yes/No) This quickly screens applicants for essential skills.
- Lead Capture: "Would you like to receive more information about our services?" (Yes/No) This identifies potential leads and allows for permission-based follow-up.
Pros:
- Extremely easy for respondents: Minimizes cognitive load and encourages participation.
- Unambiguous responses: Reduces the risk of misinterpretation and ensures data clarity.
- Ideal for factual questions: Efficiently collects objective information.
- High completion rates: Encourages respondents to finish the survey due to its brevity.
- Straightforward analysis: Simplifies data interpretation and reporting.
Cons:
- Lacks nuance and detail: Doesn't capture the complexity of opinions or attitudes.
- Doesn't capture intensity of opinions: Fails to measure how strongly a respondent feels.
- Can force choices when reality is more complex: Oversimplification can lead to inaccurate data.
- May oversimplify complex issues: Binary options may not adequately represent the range of perspectives.
- Not suitable for measuring attitudes or perceptions: Better suited for factual or screening questions.
Tips for Effective Use:
- Use only when binary answers make sense: Ensure the question can be accurately answered with a simple "Yes" or "No."
- Consider adding follow-up questions for context: Explore the "why" behind the initial "Yes/No" response.
- Ensure mutual exclusivity between options: Prevent overlap or confusion between the two choices.
- Avoid leading or biased wording: Maintain objectivity to ensure unbiased responses.
- Consider adding 'Not sure' or 'Prefer not to say' when appropriate: Give respondents the option to opt out if they don't have a definitive answer or prefer not to disclose certain information.
Why Dichotomous Questions Deserve a Place in Your Survey Toolkit:
Dichotomous questions are indispensable for efficiently gathering quantifiable data, particularly when dealing with large sample sizes or when you need to quickly segment your audience. While they lack the depth of qualitative questions, their simplicity and ease of analysis make them an invaluable asset in various situations, from market research and lead generation to event planning and HR. Understanding when and how to leverage the power of dichotomous questions is crucial for anyone seeking to collect actionable data and gain valuable insights. They are a fundamental component when considering qualitative vs quantitative survey questions for maximizing data collection efficiency.
Qualitative vs Quantitative Question Types Comparison
| Question Type | Implementation Complexity 🔄 | Resource Requirements 🔄 | Expected Outcomes 📊⭐ | Ideal Use Cases 💡 | Key Advantages ⚡⭐ |
|---|---|---|---|---|---|
| Open-Ended Questions | High | High | Rich, detailed qualitative insights | Exploratory research, understanding "why" | Captures nuanced opinions; uncovers unexpected info |
| Multiple Choice Questions | Low | Low | Structured, easy-to-analyze quantitative data | Large sample surveys, pattern identification | Quick to complete; consistent, comparable data |
| Likert Scale Questions | Medium | Medium | Quantified attitudes, nuanced opinions | Measuring satisfaction, opinion intensity | Easy to understand; enables advanced statistical analysis |
| Rating Scale Questions | Low to Medium | Low to Medium | Granular numeric evaluations | Customer satisfaction, benchmarking | Intuitive; good for tracking trends |
| Semantic Differential Questions | Medium | Medium | Multi-dimensional perception profiles | Brand perception, emotional/rational responses | Captures subtle perceptions; good for comparative studies |
| Dichotomous Questions | Very Low | Very Low | Clear, binary quantifiable data | Screening, factual queries, simple opinions | Extremely easy; high completion rates |
Power Up Your Surveys with BuildForm
Mastering the art of crafting effective qualitative vs. quantitative survey questions is paramount for gathering insightful data. From understanding the nuances of open-ended questions that unveil rich narratives to leveraging the precision of multiple-choice, Likert scale, rating scale, semantic differential, and dichotomous questions for quantifiable insights, you now have a powerful toolkit at your disposal. Remember, the key lies in selecting the right question type to align with your specific research objectives. By strategically combining both qualitative and quantitative approaches, you gain a holistic understanding of your target audience, enabling you to make data-driven decisions that fuel growth. If you're aiming to boost your website's performance by leveraging the insights gleaned from your surveys, strong SEO practices are essential. For further guidance on crafting effective website content that incorporates both qualitative and quantitative data for optimal SEO performance, explore this comprehensive guide on creating SEO content from Outrank, The Ultimate Guide to Creating SEO Content for Website Success.
Effectively using these survey question types empowers you to gather richer data, validate assumptions, identify trends, and personalize experiences, ultimately leading to more effective strategies across various fields – from marketing and sales to HR, event planning, and academic research. By understanding the strengths of each question type, you can tailor your surveys to extract the most valuable information and drive meaningful outcomes.
Ready to transform your data collection process? BuildForm makes crafting impactful surveys using both qualitative and quantitative questions easier than ever. Visit BuildForm today and unlock the potential of AI-powered survey creation, complete with intelligent features and real-time analytics to help you gather the insights you need.