
Understanding Student Questionnaires
This listicle provides seven example questionnaires for students, helping you choose the right one for your needs. You'll learn about Likert Scale, Multiple Choice, Open-Ended, Matrix/Grid, Semantic Differential, Ranking/Priority, and Mixed-Method questionnaires. Effective questionnaires are crucial for gathering valuable student feedback, improving learning experiences, and evaluating courses or programs. Choosing the right format is key to obtaining useful data. Whether you're an educator, researcher, or administrator, this guide offers practical examples and best-use scenarios for each type of example questionnaire for students.
1. Likert Scale Questionnaire
When it comes to gathering student feedback and understanding their perspectives, the Likert Scale questionnaire reigns supreme as a versatile and effective tool. This psychometric scale, developed by Rensis Likert in 1932, allows you to gauge students' attitudes, opinions, and perceptions on a variety of topics, making it an invaluable asset for educators, researchers, and anyone working within an educational setting. This method deserves its place on this list due to its simplicity, quantifiability, and wide acceptance in educational research and assessment.
The Likert Scale operates on a symmetric agree-disagree scale, typically with 5 or 7 points. Students respond to a series of statements by indicating the extent to which they agree or disagree, ranging from "Strongly Disagree" to "Strongly Agree." This allows for a nuanced understanding of their feelings, going beyond simple yes/no responses and capturing the intensity of their opinions. This quantifiable ordinal data can then be analyzed statistically to identify trends and patterns.
How it Works:
A Likert Scale questionnaire presents a series of statements related to the topic being investigated. For example, in a student satisfaction survey, a statement might be: "I am satisfied with the quality of instruction in this course." Students then select their level of agreement or disagreement on the provided scale. A 5-point scale would typically look like this:
- Strongly Disagree
- Disagree
- Neutral
- Agree
- Strongly Agree
Successful Implementations:
Likert Scales have proven effective in various educational contexts. They're commonly used in student satisfaction surveys, course evaluations, teacher performance assessments, and feedback mechanisms within learning management systems (LMS). They also play a crucial role in academic stress and well-being studies, providing valuable insights into student mental health. For example, a university might use a Likert Scale to measure student satisfaction with library resources, while a teacher might use it to gather feedback on their teaching methods.
Actionable Tips for Using Likert Scales:
- Use an odd-numbered scale (like 5 or 7) to allow for a neutral response. This avoids forcing students to choose a side when they genuinely have no opinion.
- Include both positively and negatively phrased statements to reduce acquiescence bias (the tendency to agree with all statements). For example, alongside "I find the course material engaging," you might include "I find the course material difficult to understand."
- Keep statements clear, concise, and avoid double-barreled questions (questions that ask about two separate things). Each statement should focus on a single, specific aspect.
- Consider using a 7-point scale for more granular data, especially if you anticipate a wide range of opinions.
- Always pilot test your questionnaire with a small group of students before deploying it to the wider population. This helps identify any ambiguities or issues with the questions.
Pros and Cons:
Pros:
- Easy for students to understand and complete.
- Provides quantifiable data for analysis.
- Reduces survey bias compared to yes/no questions.
- Widely accepted and validated method.
- Allows for measurement of attitude intensity.
Cons:
- Potential for central tendency bias (students choosing middle options).
- Cultural differences in scale interpretation.
- May not capture complex opinions fully.
- Susceptibility to acquiescence bias.
- Limitations of ordinal data in some statistical analyses.
The infographic below provides a quick reference for the key features of a Likert Scale Questionnaire:
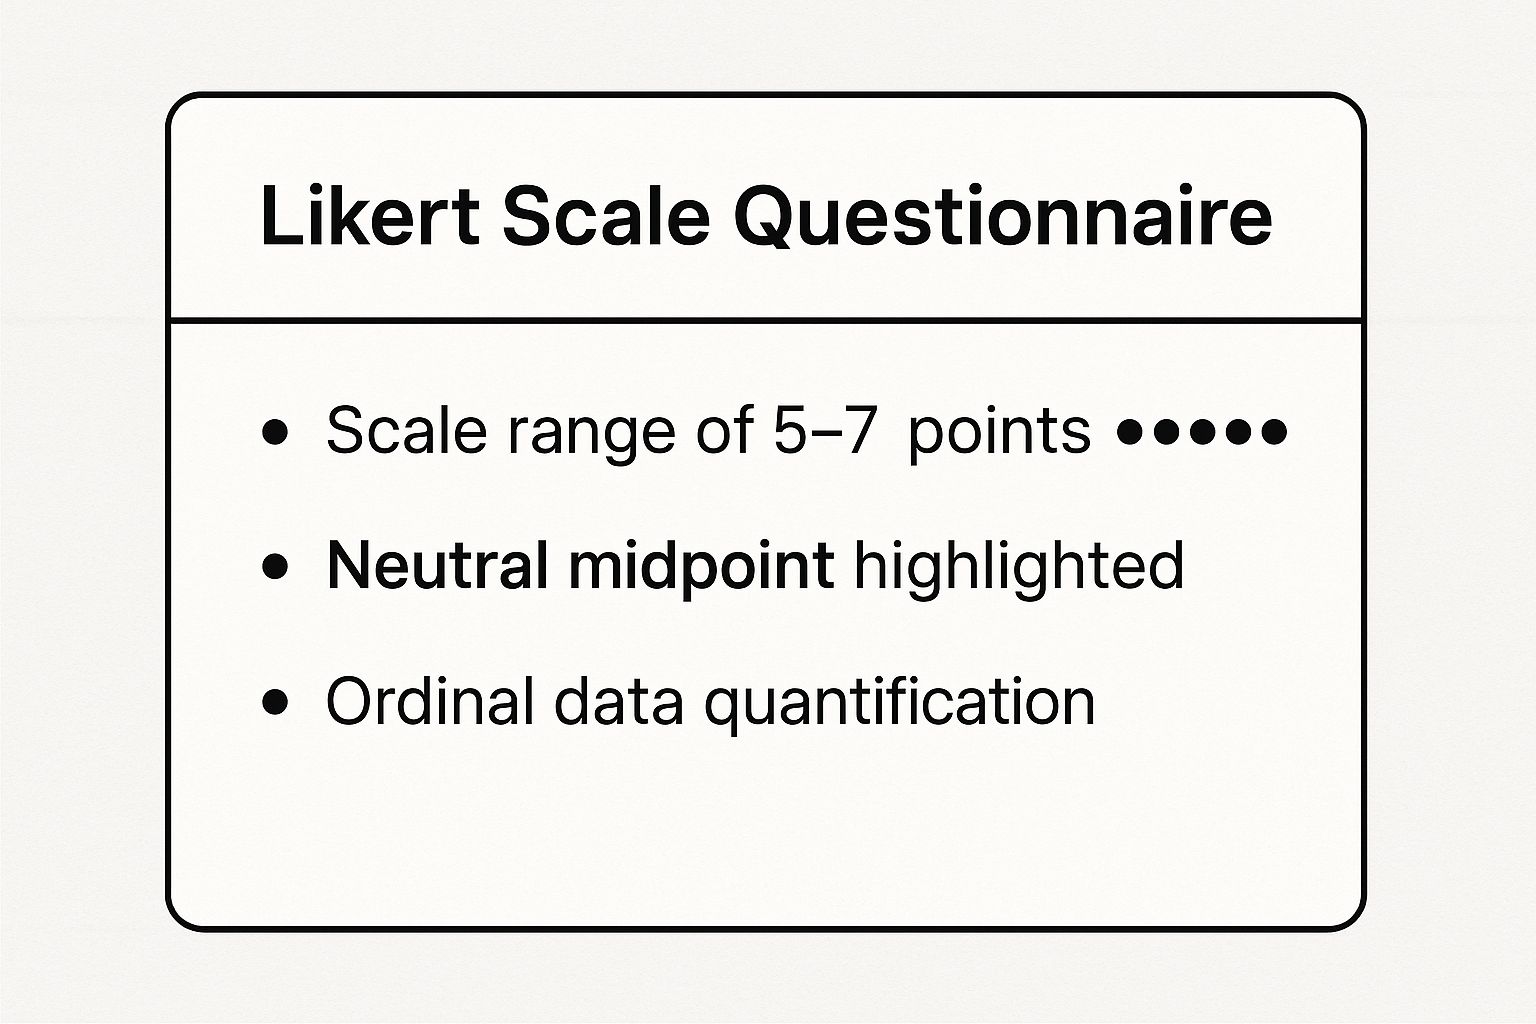
This infographic visualizes the core components of a Likert Scale, emphasizing the 5-7 point range, the crucial neutral midpoint, and the resulting ordinal data. The visualization reinforces the importance of these elements in designing effective Likert Scale questionnaires for students.
When and Why to Use Likert Scales:
Likert Scale questionnaires are ideal when you need to gather quantifiable data about student opinions, attitudes, and perceptions. They are particularly useful for:
- Evaluating course effectiveness
- Assessing teacher performance
- Measuring student satisfaction
- Gauging student well-being
- Gathering feedback on learning resources
- Conducting research on educational topics
By using Likert Scales strategically and following the tips outlined above, you can gather valuable insights into the student experience and use that data to improve educational outcomes. Whether you're a teacher, researcher, or administrator, the Likert Scale questionnaire is an indispensable tool for understanding the student perspective.
2. Multiple Choice Questionnaire
The multiple choice questionnaire stands as a cornerstone in student data collection, offering a structured and efficient approach to gathering information. As a core component of any "example questionnaire for students," this format presents a versatile tool for educators, researchers, and administrators alike. It involves presenting respondents with a question followed by a predetermined list of options from which they select the most appropriate answer(s). This method's popularity stems from its ease of administration, analysis, and scalability, making it a valuable asset for various educational contexts.
Multiple choice questionnaires excel in scenarios requiring standardized responses, making them ideal for assessing student knowledge, understanding, and preferences. Whether you're evaluating learning outcomes, gauging student satisfaction with campus services, or collecting demographic information, this format provides a reliable and consistent framework. Its structured nature eliminates ambiguity in responses, enabling efficient data analysis and reporting.
How Multiple Choice Questionnaires Work:
The core principle lies in presenting a question or statement, followed by a set of options, typically ranging from three to seven. These options may include a single correct answer (suitable for knowledge assessments) or multiple applicable choices (useful for exploring student preferences or opinions). Respondents select the option(s) that best reflect their answer. Often, an "Other" option with a free-text field can be included to accommodate responses not covered within the predetermined choices, offering a degree of flexibility within the structured format.
Features and Benefits:
Multiple choice questionnaires possess distinct features that contribute to their widespread adoption:
- Predetermined Response Options: This standardization ensures consistency and simplifies data analysis, unlike open-ended questions where responses can vary widely.
- Single or Multiple Selection Capabilities: The format allows for questions requiring a single best answer or those allowing respondents to choose multiple applicable options.
- "Other" Option with Text Field: This feature enhances inclusivity by capturing responses outside the predefined options, providing valuable qualitative insights.
- Standardized Response Format: This facilitates efficient coding and statistical analysis, allowing for easy quantification and comparison of responses.
- Easy to Code and Analyze Statistically: Data gathered can be readily analyzed using statistical software, providing valuable insights into trends and patterns.
Pros:
- Quick and Easy for Students to Complete: This reduces survey fatigue and encourages higher response rates.
- Eliminates Ambiguity in Responses: The predefined options minimize interpretation issues, resulting in cleaner data.
- Facilitates Large-Scale Data Collection: Ideal for surveys involving large student populations.
- Reduces Interviewer Bias: The standardized format minimizes the influence of the researcher or administrator on the responses.
- Cost-Effective for Large Populations: Compared to other methods like interviews, multiple choice questionnaires are significantly more economical.
Cons:
- Limited to Predetermined Options: May restrict the range of student perspectives and fail to capture nuanced opinions.
- May Miss Important Student Perspectives: Relying solely on pre-set options can overlook valuable insights not anticipated during questionnaire development.
- Risk of Leading Respondents: Poorly worded options can inadvertently influence student choices.
- Difficult to Capture Nuanced Opinions: The structured format may not be suitable for exploring complex issues in depth.
- Requires Careful Option Development: Developing clear, concise, and mutually exclusive options is crucial for obtaining valid and reliable data.
Examples of Successful Implementation:
- Student Demographic Surveys: Collecting information about student backgrounds, including age, gender, ethnicity, and socioeconomic status.
- Course Preference Selections: Allowing students to indicate their preferred courses for upcoming semesters.
- Learning Style Assessments: Identifying students' preferred learning modalities, such as visual, auditory, or kinesthetic.
- Campus Facility Usage Studies: Understanding how students utilize campus facilities like libraries, gyms, and dining halls.
- Academic Program Evaluations: Gathering student feedback on the effectiveness and quality of academic programs.
Actionable Tips for Creating Effective Multiple Choice Questionnaires:
- Include an "Other" option when appropriate: Provide an open text field to capture responses not covered by the listed options.
- Ensure options are mutually exclusive: Avoid overlapping categories to prevent confusion and ensure accurate responses.
- Use parallel structure in option wording: Maintain consistency in grammar and phrasing to enhance clarity.
- Limit options to 5-7 choices when possible: Too many options can overwhelm respondents and increase cognitive load.
- Randomize option order to reduce bias: This mitigates the potential influence of option placement on respondent choices.
Learn more about Multiple Choice Questionnaire
Multiple choice questionnaires are a valuable tool for gathering student data efficiently and effectively. By understanding their strengths and limitations, and by following best practices in questionnaire design, educators and researchers can leverage this format to gain valuable insights into student experiences, preferences, and learning outcomes. This makes the multiple choice questionnaire a crucial inclusion in any comprehensive list of example questionnaires for students.
3. Open-Ended Questionnaire
Open-ended questionnaires represent a powerful tool in qualitative research, offering a way to gather rich, nuanced data directly from students. Unlike structured questionnaires with pre-defined answer choices, open-ended questionnaires allow students to express themselves freely in their own words, providing valuable insights into their experiences, opinions, and suggestions. This approach encourages elaborate responses and personal reflection, painting a more complete picture of the student perspective. This makes them particularly valuable for exploring complex issues, understanding individual narratives, and uncovering unexpected themes. This method earns its place in this list due to its ability to capture the “why” behind student behaviors and choices, information that often remains hidden in quantitative surveys.

The core feature of an open-ended questionnaire is the free-form text response. There are no predetermined answer options, giving students the freedom to articulate their thoughts comprehensively. This flexibility in response length allows for both concise answers and detailed explanations, catering to different communication styles and levels of engagement. This method captures individual voice and perspective, providing authentic student feedback unconstrained by pre-set categories. This authenticity makes open-ended questionnaires particularly effective for gathering detailed and nuanced student insights, allowing unexpected findings to emerge organically from the data.
Consider a university seeking feedback on a new online learning platform. A traditional multiple-choice survey might ask students to rate their satisfaction on a scale of 1 to 5. While this provides a quantifiable measure, it doesn't explain why a student chose a particular rating. An open-ended questionnaire, on the other hand, could ask, "What are your thoughts on the new online learning platform?" This allows students to elaborate on their experiences, highlighting specific aspects they find helpful or frustrating. Perhaps they appreciate the platform's accessibility but struggle with its navigation. These detailed insights offer a much richer understanding of the student experience and can lead to more targeted improvements.
Several examples showcase the successful implementation of open-ended questionnaires in educational settings. Student experience reflection surveys can reveal valuable insights into how students perceive their learning environment. Course improvement suggestion forms can help educators identify areas for enhancement and tailor their teaching methods. Campus climate assessment studies can shed light on student perceptions of diversity, inclusion, and safety. Graduate exit interviews can provide crucial feedback on program effectiveness and career preparedness. Finally, academic support needs assessments can help institutions understand and address the challenges faced by students in their academic pursuits.
While open-ended questionnaires offer numerous benefits, they also present certain challenges. Analyzing free-form text responses is inherently time-consuming and requires qualitative analysis skills, such as coding and thematic analysis. The effort required to answer open-ended questions can also lead to lower response rates compared to quicker, multiple-choice surveys. Additionally, the data gathered is difficult to quantify and compare statistically. Finally, open-ended questions can sometimes produce irrelevant or unclear responses, requiring careful interpretation and follow-up.
To maximize the effectiveness of open-ended questionnaires, consider the following tips: Use specific, focused questions to guide student responses and avoid ambiguity. Provide examples of expected response types to clarify expectations and encourage thoughtful answers. Limit the number of open-ended questions to avoid overwhelming respondents and improve completion rates. Use prompts to guide thinking and encourage deeper reflection. Finally, consider a hybrid approach by incorporating some structured questions alongside open-ended ones to gather both quantitative and qualitative data. This blended approach can offer a comprehensive understanding of student perspectives.
Open-ended questionnaires are popular among qualitative researchers in education, student affairs professionals, and educational ethnographers seeking in-depth understanding of student experiences. If you're interested in delving deeper into the differences between qualitative and quantitative survey questions, learn more about Open-Ended Questionnaire. Whether you're a freelancer seeking feedback on a new service, a marketing team gauging customer sentiment, an event planner evaluating event satisfaction, an HR professional gathering employee feedback, or a researcher exploring a complex social issue, open-ended questionnaires can provide invaluable insights that drive informed decision-making. Remember that while creating an example questionnaire for students, choosing the right questions – open-ended or otherwise – is key to gaining a meaningful understanding of the student experience.
4. Matrix/Grid Questionnaire
The matrix/grid questionnaire is a powerful tool in the arsenal of anyone designing an example questionnaire for students, or any questionnaire for that matter. It offers a streamlined and visually organized approach to collecting data on multiple related items, making it particularly useful for comprehensive assessments without overwhelming respondents. This format presents a series of questions (items) arranged in rows, with a common set of response options (rating scale) displayed in columns. This grid layout allows students to evaluate multiple aspects using the same criteria, promoting consistency and efficiency in the response process. Its space-saving design makes it ideal for both print and online surveys.
The matrix/grid questionnaire shines when you need to gather feedback on several related aspects of a single topic. For instance, in a course evaluation, students might rate different aspects of the course, such as the instructor's clarity, the relevance of the materials, and the effectiveness of the assignments, all using the same scale (e.g., Strongly Agree to Strongly Disagree). This format allows for easy comparison of responses across different items, providing a holistic view of student perceptions. This method is invaluable for educators, researchers, and anyone seeking structured feedback on a multi-faceted subject. This is why it earns a prominent place in any list of effective questionnaire formats, particularly for students.
The benefits of this format are numerous. Its space-efficient design reduces survey length and completion time, which is crucial for maximizing response rates, especially among busy students. The consistent rating criteria and visual organization simplify the response process and minimize respondent fatigue. The clear structure also makes it easy to analyze and interpret the data. Imagine comparing student satisfaction with different campus services or assessing learning outcomes across multiple modules – the matrix format simplifies both data collection and subsequent analysis.
However, like any methodology, matrix/grid questionnaires have potential drawbacks. One common issue is "straightlining," where respondents select the same response for all items, either due to lack of attention or a desire to quickly finish the survey. Another concern is the potential for confusion on smaller screens, particularly mobile devices, where the grid layout might be difficult to navigate. Additionally, if the items don't logically fit the same scale, the responses can be misleading.
To maximize the effectiveness of matrix/grid questions in your example questionnaire for students, consider these tips:
- Limit the number of items: Keep each matrix to a maximum of 5-10 items to prevent respondent fatigue and maintain focus. For longer lists, consider breaking them into smaller, more manageable sections.
- Ensure scale applicability: Carefully select items that logically align with the chosen rating scale. All items should be measurable using the same criteria. For example, asking about both "frequency of attendance" and "quality of instruction" on a scale of "Excellent to Poor" wouldn't be appropriate.
- Test mobile responsiveness: Always preview and test your questionnaire on different devices, particularly smartphones and tablets, to ensure readability and ease of navigation.
- Include attention check items: Incorporate questions that gauge respondent attentiveness, such as reverse-coded items or questions with obvious answers, to identify and potentially filter out careless responses.
- Consider breaking large matrices: If dealing with a large number of items, divide them into smaller, thematic matrices to improve clarity and prevent overwhelming respondents.
The matrix/grid questionnaire has been widely adopted by educational survey researchers, institutional research offices, and online survey platforms. Its efficiency and ease of use make it a valuable tool for collecting structured data in a variety of educational contexts. By understanding its strengths and limitations, and by implementing the tips outlined above, you can effectively utilize this format in your questionnaires for students to gather meaningful and actionable insights.
5. Semantic Differential Scale
The Semantic Differential Scale stands out as a powerful tool in any example questionnaire for students, offering a nuanced way to gauge attitudes and perceptions beyond simple agreement or disagreement. Developed by Charles Osgood in 1957, this method delves into the connotative meanings students associate with specific educational concepts, courses, or experiences. Instead of asking direct questions, it presents respondents with a series of bipolar adjective pairs and asks them to rate the concept on a scale between these opposing terms. This approach provides valuable insights into the emotional and subjective associations students have with different aspects of their education.
How it Works:
The Semantic Differential Scale utilizes a series of bipolar scales, typically with seven points. Each scale represents a continuum between two opposing adjectives, such as "easy-difficult," "engaging-boring," or "relevant-irrelevant." Students mark their position on the scale based on their perception of the concept being evaluated. For example, if a student finds a particular course very engaging, they would mark a point closer to the "engaging" end of the scale. The visual nature of the scale makes it easy for students to understand and respond to, while the use of bipolar adjectives allows for the capture of subtle differences in perception.
Examples of Successful Implementation:
The versatility of the Semantic Differential Scale makes it applicable across diverse educational contexts. It has proven particularly effective in:
- Brand perception studies of educational institutions: Prospective students can rate universities on scales like "prestigious-ordinary" or "innovative-traditional," offering insights into their image and perceived value.
- Course atmosphere and environment assessments: Students can evaluate their classroom experience on scales like "supportive-competitive" or "stimulating-dull," helping instructors understand the learning environment they create.
- Teacher personality and style evaluations: Students can rate instructors on scales like "approachable-intimidating" or "clear-confusing," providing feedback on teaching styles and effectiveness.
- Learning experience characterization: The scale can assess learning activities on scales like "challenging-easy" or "meaningful-pointless," revealing how students perceive the value and difficulty of different educational approaches.
- Campus culture perception studies: Students can rate the overall campus environment on scales like "inclusive-exclusive" or "vibrant-apathetic," providing valuable data for campus improvement initiatives. This makes it a particularly useful tool for researchers and educators conducting surveys and data collection related to student experiences.
Actionable Tips for Using the Semantic Differential Scale in an Example Questionnaire for Students:
- Careful Adjective Selection: Choose adjective pairs that are relevant to the concept being evaluated and meaningful to the target population. Avoid jargon or overly technical terms.
- Randomize Pole Positions: Alternate the placement of positive and negative adjectives on the left and right sides of the scale to minimize response bias.
- Optimal Discrimination with 7-Point Scales: Seven-point scales generally provide sufficient granularity to capture nuanced responses while remaining manageable for respondents.
- Pilot Testing: Before deploying the questionnaire, conduct a pilot test with a representative sample of the target population to ensure clarity and identify potential issues with adjective interpretation. This is especially important when designing an example questionnaire for students, as their understanding and interpretation of terms can vary.
- Cultural Sensitivity: Consider the cultural appropriateness of the chosen terms, especially in diverse student populations. Different cultures may interpret adjectives differently, leading to inaccurate results.
Pros and Cons:
Pros:
- Captures nuanced attitudes and perceptions.
- Visually appealing and engaging for respondents.
- Reduces acquiescence bias (the tendency to agree with all statements).
- Measures multiple dimensions of a concept simultaneously.
- Suitable for cross-cultural research with careful adaptation.
Cons:
- Requires careful selection of appropriate adjective pairs.
- May be unfamiliar to some students, requiring clear instructions.
- Potential for cultural differences in adjective interpretation.
- Limited to concepts that can be described along bipolar dimensions.
- More complex to analyze statistically compared to simpler scales like Likert scales.
The Semantic Differential Scale holds a deserved place in any example questionnaire for students due to its ability to capture the rich, subjective meanings students associate with their educational experiences. By understanding these underlying connotations, educators and researchers can gain valuable insights into student perceptions, preferences, and needs, enabling them to create more effective learning environments and tailor educational offerings to better serve their student population. It is a valuable tool for freelancers, solopreneurs, marketing and sales teams, event planners, HR professionals, and anyone seeking to gather detailed feedback and understand perceptions in a deeper way.
6. Ranking/Priority Questionnaire
A Ranking/Priority Questionnaire is a powerful tool in an example questionnaire for students, offering a unique approach to understanding student preferences and priorities. Unlike traditional rating scales where students evaluate each item independently, a ranking questionnaire requires them to compare items and arrange them in order of importance, from highest to lowest. This forced-choice format provides valuable insights into relative importance and avoids the common issue of students rating everything as “important.” This makes it an invaluable asset for educators, administrators, and researchers seeking to understand student needs and preferences.
This method works by presenting students with a list of items related to a specific topic, such as course selection, campus improvements, or career goals. Students then carefully consider each item and rank them based on their individual preferences or perceived importance. This process of comparative judgment reveals not just what students value, but also the relative importance they place on different options. For instance, a student might value both small class sizes and access to research opportunities, but a ranking questionnaire would reveal which of these factors they prioritize when making course selection decisions.
The key features of a Ranking/Priority Questionnaire include:
- Comparative evaluation: Students directly compare multiple items, leading to more nuanced data.
- Forced ranking: The requirement to rank items from highest to lowest priority compels students to make difficult decisions and reveals their true preferences.
- Reveals relative importance: It highlights not just what is important, but what is most important relative to other options.
- Eliminates response scale bias: By avoiding traditional rating scales, this method minimizes the influence of response biases like acquiescence bias (the tendency to agree with all statements).
- Creates ordinal preference data: The ranked data provides insights into the order of preference, enabling a deeper understanding of student priorities.
Examples of Successful Implementation:
- Course Selection Priority Surveys: Students rank potential elective courses based on their interest and relevance to their career goals. This information can help advisors guide students toward appropriate courses and help departments understand student demand.
- Campus Improvement Priority Assessments: Students rank potential campus improvements, such as new study spaces, improved dining facilities, or upgraded recreational facilities, helping administrators allocate resources effectively.
- Career Goal Ranking Exercises: Students rank potential career paths based on their perceived desirability, providing valuable data for career counseling services.
- Learning Method Preference Studies: Students rank different learning methods, such as lectures, group work, online learning, and hands-on activities, helping educators tailor their teaching strategies.
- Student Service Importance Rankings: Students rank the importance of various student services, such as academic advising, library resources, health services, and career counseling, allowing universities to optimize service delivery.
Actionable Tips for Creating Effective Ranking/Priority Questionnaires:
- Limit the number of items: Keep the list to 5-10 items to avoid cognitive overload and ensure meaningful comparisons. Ranking a large number of items can be frustrating and lead to less reliable results.
- Ensure items are comparable and relevant: All items should relate to the same topic and be of a similar nature to allow for meaningful comparisons. Comparing apples and oranges won't yield useful results.
- Provide clear ranking instructions: Explain the ranking process clearly and provide examples to minimize confusion and ensure accurate responses.
- Consider partial ranking for large item sets: If you must include more than 10 items, consider asking students to rank only their top 5 or bottom 5 choices to reduce the cognitive burden.
- Use drag-and-drop interfaces: Online platforms with drag-and-drop functionality make the ranking process easier and more engaging for students.
Pros and Cons:
While Ranking/Priority Questionnaires offer valuable insights, it's crucial to be aware of their limitations:
Pros:
- Forces difficult decisions and trade-offs, leading to more realistic data.
- Eliminates “everything is important” responses, providing clearer priorities.
- Reveals true priorities and relative importance.
- Useful for resource allocation decisions and program development.
- Reduces acquiescence bias.
Cons:
- Assumes all items can be meaningfully ranked, which may not always be the case.
- Can be frustrating for students with close preferences between items.
- Difficult to manage with a large number of items.
- May not perfectly reflect real-world decision making where other factors influence choices.
- Limited statistical analysis options compared to rating scales.
Despite these limitations, the Ranking/Priority Questionnaire remains a valuable tool for understanding student preferences and priorities. By carefully considering the tips outlined above and being mindful of the potential drawbacks, researchers and educators can effectively utilize this method in their example questionnaires for students, gaining crucial insights that inform decision-making and improve student experiences.
7. Mixed-Method/Hybrid Questionnaire: A Comprehensive Approach to Student Feedback
The mixed-method, or hybrid, questionnaire represents a powerful tool in the arsenal of anyone designing an example questionnaire for students. This approach leverages the strengths of both quantitative and qualitative data collection methods by combining various question formats within a single survey instrument. By strategically integrating question types like Likert scales, multiple-choice, open-ended responses, and potentially even ranking or matrix questions, researchers and educators can gain a much deeper and more nuanced understanding of student perspectives. This approach allows for a comprehensive data collection approach that provides both breadth and depth of information, making it ideal for a range of applications in educational settings.
A hybrid questionnaire works by presenting students with a variety of question formats, each designed to elicit a different type of response. For instance, a Likert scale can gauge agreement or disagreement with a particular statement, offering quantifiable data for statistical analysis. Multiple-choice questions provide structured responses ideal for quick analysis and comparison, while open-ended questions allow students to express their thoughts and feelings in their own words, providing rich qualitative data. This combination allows for a more holistic understanding of complex issues and provides multiple perspectives on a single topic.
The benefits of using a mixed-method questionnaire are numerous. By incorporating both quantitative and qualitative data, researchers can triangulate their findings, meaning they can cross-validate data from different sources to increase the reliability and validity of their conclusions. For example, if quantitative data from a Likert scale suggests low student satisfaction with a particular course element, researchers can delve deeper into the why behind this dissatisfaction through the qualitative data gathered from open-ended questions. This depth of understanding is crucial for effective intervention and improvement.
Moreover, the variety of question formats inherent in a hybrid approach helps to maintain student engagement and reduce survey fatigue, a common problem with lengthy questionnaires. The alternating format keeps respondents interested and encourages more thoughtful responses. This increased engagement translates to higher completion rates and richer, more valuable data.
However, this robust approach also presents some challenges. Mixed-method questionnaires can be more time-consuming for students to complete and more complex for researchers to design and analyze. Analyzing qualitative data requires careful interpretation and coding, often a more time-intensive process than analyzing quantitative data. The potential for survey fatigue, despite the varied format, remains a concern, especially with lengthy surveys. Therefore, careful planning and thoughtful design are essential.
Examples of successful implementation of mixed-method questionnaires for students include:
- Comprehensive course evaluation systems: Gathering both quantitative ratings on course aspects and qualitative feedback on areas for improvement.
- Student experience and satisfaction studies: Exploring student perceptions of campus life, academic support services, and overall well-being.
- Campus climate assessments: Assessing student experiences related to diversity, inclusion, and equity using both scaled questions and open narratives.
- Academic program reviews: Evaluating program effectiveness through quantitative performance data and qualitative feedback from students and faculty.
- Student success and retention studies: Identifying factors contributing to student persistence and graduation, combining statistical data with student perspectives.
To effectively utilize a mixed-method questionnaire for students, consider the following tips:
- Strategic Placement: Start with structured questions (multiple-choice, Likert scales) to build momentum and then introduce open-ended questions later to capture deeper insights.
- Balance is Key: Strive for a balance between different question types to avoid overwhelming respondents with one particular format.
- Logic Branching: Use logic branching or skip patterns to personalize the survey experience, ensuring students only answer relevant questions.
- Progress Indicators: Include a progress bar to visually indicate how much of the questionnaire remains, reducing anxiety and encouraging completion.
- Thorough Testing: Pilot test the questionnaire with a small group of students before widespread deployment to identify any issues with clarity, flow, or length. This allows for refinements and ensures the final version is effective in gathering the desired information.
The mixed-method questionnaire deserves a prominent place in any discussion about example questionnaires for students due to its versatility and capacity to capture both the "what" and the "why" behind student perspectives. By strategically combining different question formats, researchers can obtain a richer, more nuanced understanding of complex issues, ultimately leading to more effective interventions and improvements within educational settings. This approach is invaluable for anyone seeking a comprehensive and insightful approach to gathering student feedback.
7 Questionnaire Formats Comparison
| Format | Implementation Complexity 🔄 | Resource Requirements 🔄 | Expected Outcomes ⭐📊 | Ideal Use Cases 💡 | Key Advantages ⚡💡 |
|---|---|---|---|---|---|
| Likert Scale Questionnaire | Moderate | Moderate (design + statistical analysis) | Quantifiable ordinal data; measures attitude intensity ⭐ | Measuring attitudes toward courses, teaching, services | Easy to understand; widely validated; reduces bias |
| Multiple Choice Questionnaire | Low | Low (predetermined options) | Standardized, easily comparable data ⚡📊 | Demographics, preferences, knowledge checks | Quick to complete; eliminates ambiguity; cost-effective |
| Open-Ended Questionnaire | High | High (qualitative analysis skills) | Rich, detailed insights; authentic student voice ⭐ | Exploring experiences, suggestions, complex attitudes | Captures nuanced info; allows unexpected findings |
| Matrix/Grid Questionnaire | Moderate to High | Moderate (design + mobile testing) | Efficient comparison across multiple items; space-saving ⚡📊 | Comprehensive assessments with related criteria | Reduces survey length; consistent structure; easy to compare |
| Semantic Differential Scale | Moderate | Moderate (careful adjective selection) | Nuanced perceptions and emotional associations ⭐ | Perception studies; cross-cultural attitude research | Engaging format; reduces acquiescence bias |
| Ranking/Priority Questionnaire | Moderate | Moderate (design and analysis) | Reveals true priorities and trade-offs ⭐📊 | Priority/importance assessments, resource allocation | Forces decision-making; eliminates scale bias |
| Mixed-Method/Hybrid Questionnaire | High | High (complex design + multi-analysis) | Comprehensive quantitative + qualitative insights ⭐📊 | Comprehensive program reviews and climate studies | Captures breadth and depth; engages respondents |
Creating Effective Questionnaires
Mastering the art of questionnaire design is crucial for gathering effective student feedback and data. Throughout this article, we explored several key questionnaire types, including Likert Scale, Multiple Choice, Open-Ended, Matrix/Grid, Semantic Differential Scale, Ranking/Priority, and Mixed-Method/Hybrid questionnaires. Each of these formats offers unique advantages for collecting specific types of information, from gauging student satisfaction to understanding their learning preferences. Before crafting your student questionnaire, it's essential to conduct thorough audience research to understand their demographics, interests, and learning styles. This ensures the questions are relevant, engaging, and yield meaningful insights. Top Audience Research Methods for Better Insights from revid.ai can provide you with valuable strategies for this process. By understanding these different approaches and selecting the most appropriate format for your objectives, you can collect high-quality data that leads to actionable insights.
These insights can inform curriculum development, improve teaching methodologies, and ultimately enhance the overall student learning experience. The ability to create and deploy effective questionnaires allows educators, researchers, HR professionals, marketers, and event planners to gain a deeper understanding of their target audience and tailor their approaches accordingly. This targeted approach is essential for boosting engagement, increasing conversions, streamlining recruitment processes, and facilitating more effective research.
Ready to streamline your questionnaire creation process and unlock the power of data-driven insights? BuildForm empowers you to create engaging and effective student questionnaires effortlessly. Explore the advanced features and AI-powered capabilities of BuildForm today and transform the way you collect and analyze student feedback.