
Getting Started Without Getting Lost in the Data
It's easy to feel swamped when you're staring at piles of interview transcripts, observation notes, or responses from open-ended surveys. That's a pretty common feeling. But figuring out how to analyze qualitative data well isn't just about scanning through everything to spot interesting bits. It’s more about using methodical ways to turn real human experiences into information you can act on.
To get a picture of where a lot of this detailed data comes from, take a look at how qualitative data sources usually break down:
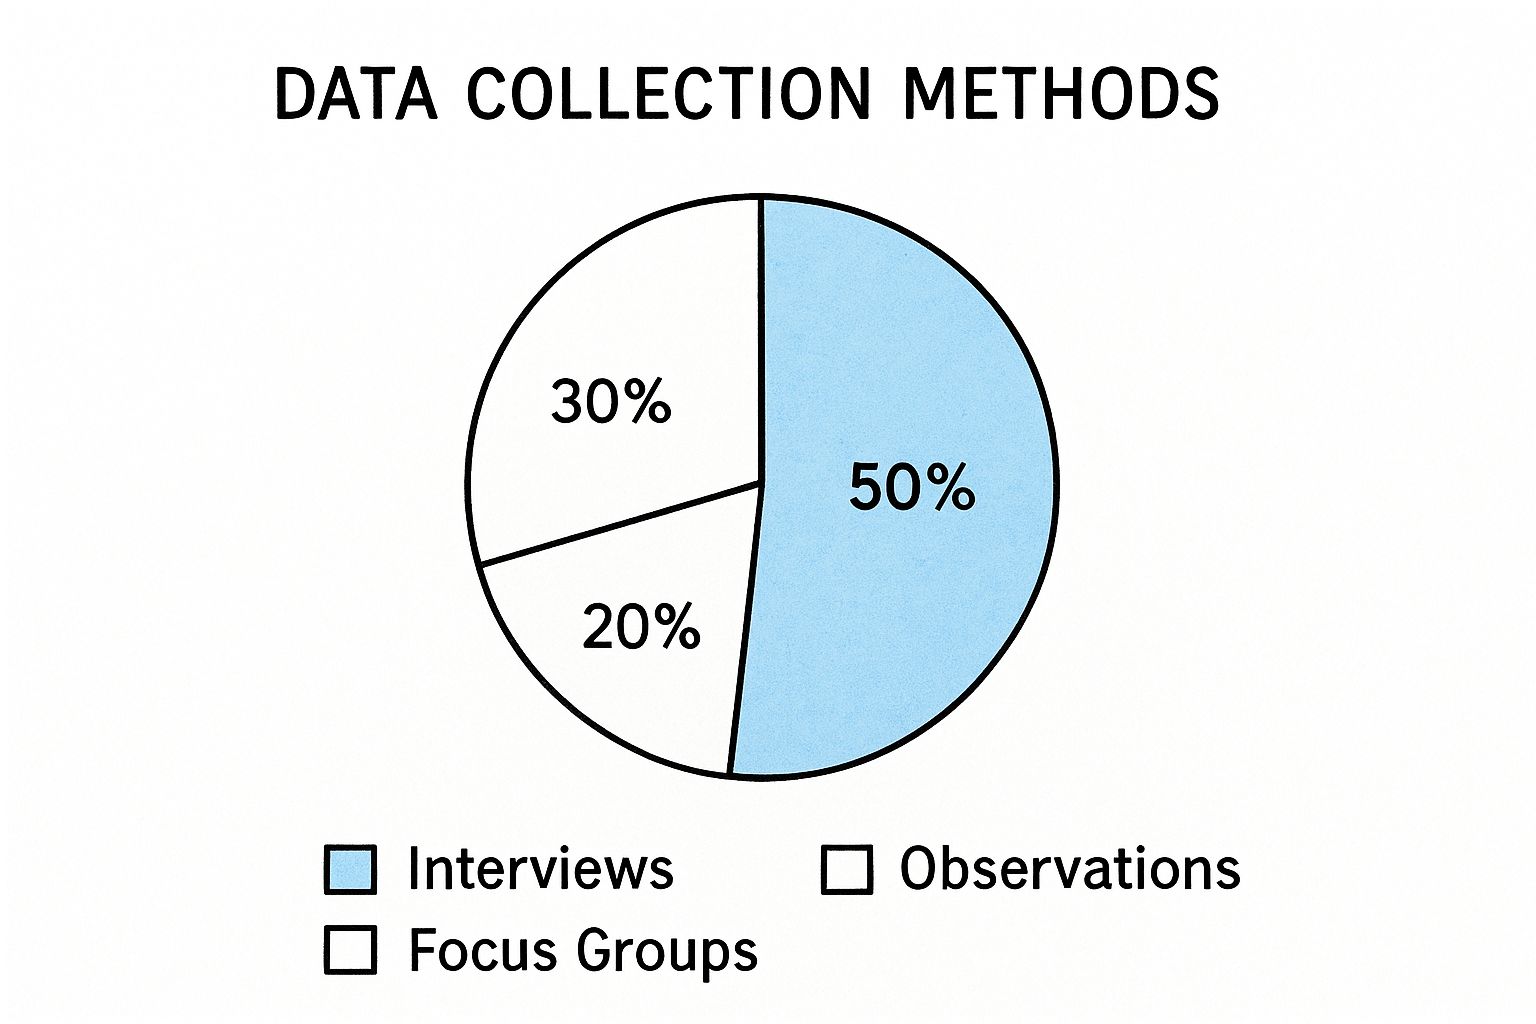
This image shows that a big chunk of qualitative insights, often around 50%, is gathered from in-depth interviews. Observations typically account for about 30%, and focus groups contribute the other 20%. Knowing these sources helps put the data you're about to work with into perspective.
Qualitative data is special because it digs into the 'why' and 'how' behind what people do and think. It offers richness and stories that numbers alone can't provide. This is different from quantitative data, which deals with things you can count or measure. So, when you analyze qualitative data, you need a mindset that values detailed, personal information, but also sticks to careful methods to make sure your conclusions are sound. It's about finding a middle ground between appreciating rich narratives and interpreting them objectively.
Understanding The Landscape of Your Data
An important first move is to clearly identify the kinds of qualitative data you've gathered. Different types of data offer unique insights and often work best with particular analytical methods. For example, the way you handle a transcript from a one-on-one interview will be different from how you examine notes taken during an energetic focus group.
Understanding these different data types is key to choosing the right analysis method. The table below provides a comparison of common qualitative data types, their typical sources, key features, and how you might approach analyzing them.
| Data Type | Source | Key Characteristics | Analysis Approach |
|---|---|---|---|
| Interviews | One-on-one conversations (in-person, phone, video) | In-depth, personal narratives, rich contextual details, allows for probing questions | Thematic analysis, Narrative analysis, Content analysis |
| Focus Groups | Moderated group discussions | Multiple perspectives, group dynamics, interaction between participants, emergent ideas | Discourse analysis, Thematic analysis, Content analysis |
| Observations | Field notes, direct observation of behaviors and environments | Contextual, behavioral insights, non-verbal cues, natural setting data | Ethnographic analysis, Content analysis, Thematic analysis |
| Open-Ended Surveys | Written responses to non-prescriptive survey questions | Varied depth, focused on specific prompts, potentially large volume of text data | Content analysis, Thematic analysis |
| Documents & Texts | Reports, articles, social media posts, emails, internal docs | Pre-existing data, historical context, official or informal communication | Content analysis, Discourse analysis, Document analysis |
Making these distinctions is vital. The nature of your data will heavily influence your choice of analytical techniques, ensuring you use the most suitable tools to find meaningful patterns and themes that answer your research questions.
Sidestepping Early Stumbling Blocks
Before you get too deep into the analysis, it's good to know about some common misunderstandings that can throw you off track. Avoiding these pitfalls will help you find more solid and insightful results as you learn how to analyze qualitative data.
Here are a few common misconceptions to watch out for:
- Thinking it's purely subjective: While qualitative data does capture personal experiences, the analysis itself needs to be systematic and clear to be trustworthy.
- Believing it's just about finding "good quotes": Strong quotes can certainly highlight your findings, but the main work of analysis is in spotting wider patterns and themes across all the data, not just picking out a few standout comments.
- Underestimating the time commitment: Thorough qualitative data analysis, particularly coding and developing themes, often takes more time than researchers first think. A study by Userpilot indicates that coding qualitative data can be quite time-consuming, especially when dealing with large amounts of data.
- Assuming one method fits all: As the table above illustrates, different data types and research goals may require different analytical strategies. Being flexible is important.
By grasping these basic points, you'll be in a better position to tackle your qualitative data with a clear plan. This way, you can avoid that initial feeling of being lost and instead focus on uncovering valuable insights.
Mastering the Art of Coding Your Data

Getting a handle on coding your data can seem a bit daunting at first, but it's actually a pretty straightforward idea. When we talk about how to analyze qualitative data, coding is a core step. It’s all about taking your raw material – like text from interviews, audio recordings, or even images – and turning it into organized insights.
Imagine you have a huge collection of books. Coding is like creating a cataloging system so you can easily find specific information and see how different ideas connect. This method helps you move from just looking at individual pieces of data to understanding the bigger picture.
From Broad Strokes to Fine Details: Proven Coding Strategies
Your coding adventure usually kicks off with something called open coding. Think of this as your initial exploration. You dive into your data, maybe interview transcripts or field notes, and start attaching simple labels or "codes" to chunks of text that catch your eye or seem important. The goal here is to capture all the interesting bits without trying to narrow things down too soon.
As you get more comfortable with your data through open coding, you'll start noticing patterns and ideas that keep popping up. This naturally moves you into selective coding, sometimes called focused coding. Here, you begin to refine those first codes and group them into larger themes or categories. This helps you see connections and build a more organized understanding of what your data is telling you.
At this point, creating a coding scheme or codebook becomes really important. This document should clearly define each code and theme, making sure it ties directly back to your main research questions. The kind of data you're working with, which is often determined by how you've set up your data collection (like your survey questions), will greatly shape this. For instance, the depth of insight you gain is very much tied to how you've phrased your questions. If you're curious about question types, you might find this article helpful: Qualitative vs. Quantitative Survey Questions: Which to Use and Why.
Ensuring Consistency and Managing Your Coding Project
Keeping things consistent is a big deal, especially when you're working with large datasets or if several researchers are involved in the coding. A really practical way to do this is by developing a clear and detailed codebook that everyone on the team uses as their guide. It's also a good idea to regularly check segments of coded data to make sure everyone is applying the codes in the same way. This helps prevent "coder drift," which is when the meaning or use of a code slowly changes over time.
Handling big coding projects can also feel like a massive job. For a long time, analyzing qualitative data meant doing a lot of manual work, like meticulously coding by hand and then figuring out themes, which can take a lot of time.
But things are changing with new developments in areas like Artificial Intelligence (AI) and Machine Learning (ML). AI-powered tools can now help automate parts of the process, like coding qualitative data, making research work faster and often more precise. For example, AI can quickly scan through huge amounts of unstructured text, finding patterns that a human might miss, which is particularly handy in qualitative market research. Some reports show that AI can process data up to 90% faster than doing it manually, with accuracy levels similar to human analysts. To learn more about this, you can check out the future trends in qualitative market research. This kind of technological help can give researchers more time to focus on the deeper interpretation of the findings.
Strengthening Your Analysis: Reliability and Collaboration
To make sure your analysis is solid and dependable, looking into inter-rater reliability is a really good move. This basically means having two or more coders independently apply the codes from your agreed-upon codebook to a sample of the data. You then measure how much they agree (using something like Cohen's Kappa). High agreement suggests the coding scheme is clear and that everyone understands how to use it consistently. If there are differences, it’s a great opportunity to talk about them and make your code definitions even clearer.
For those bigger projects, or when getting different viewpoints would be helpful, using collaborative coding strategies is essential for making your findings stronger. This could involve:
- Holding regular team meetings to talk about new themes and clear up any confusion about codes.
- Using shared digital spaces where everyone can access the coded data and notes.
- Giving different coders specific sections of data to work on at first, and then having them review each other’s work.
These methods don't just improve the quality and trustworthiness of your results; they also make the sometimes very demanding job of analyzing qualitative data feel more manageable and ultimately more rewarding.
Choosing Tools That Actually Make Your Life Easier

Picking the right support systems can truly elevate your coding and collaboration efforts. When you're trying to figure out how to analyze qualitative data, the tools you select can be the difference between a long, difficult process and a straightforward path to insightful findings. However, with an ever-increasing number of options, identifying the software or system that genuinely makes your work simpler, rather than just adding another layer of complication, is a significant challenge.
Navigating the Software Landscape
The market for qualitative data analysis software (QDAS) includes well-established names like NVivo and Atlas.ti, which are known for their extensive feature sets. Alongside these established platforms, newer options are appearing, often providing more specialized functions or more user-friendly interfaces that might better suit particular project types or team sizes. The essential thing is to evaluate what you truly require before making a commitment.
To assist you in starting, here's a look at some popular choices. This table provides a feature-by-feature comparison of leading qualitative analysis software platforms, helping you see how they stack up.
Popular Qualitative Analysis Software Comparison
Feature-by-feature comparison of leading qualitative analysis software platforms
| Software | Best For | Key Features | Price Range | Learning Curve |
|---|---|---|---|---|
| NVivo | Large, complex projects, academic research | Robust coding, text/audio/video analysis, mixed-methods, visualization | High | Steep |
| Atlas.ti | In-depth textual analysis, grounded theory | Advanced coding tools, network views, hermeneutic unit management | High | Moderate-Steep |
| MAXQDA | Mixed-methods, user-friendly interface | Comprehensive analysis tools, good visual tools, strong teamwork features | High | Moderate |
| Dedoose | Collaborative online projects, mixed-methods | Web-based, real-time collaboration, data visualization tools | Moderate | Moderate |
| Quirkos | Visual learners, smaller projects, affordability | Visual interface, drag-and-drop coding, simpler feature set | Low-Moderate | Gentle |
| Emerging AI Tools | Automated transcription, initial coding, sentiment analysis | AI-powered coding suggestions, theme identification, faster processing of large text | Varies (often subscription) | Varies (often gentle for specific tasks) |
Instead of being tempted by the longest feature list, concentrate on tools that directly aid your analytical method and research questions. For instance, if you're working with large volumes of text, a tool with strong automated transcription or AI-assisted coding features could be incredibly beneficial. Some studies indicate AI can process data up to 90% faster than manual methods for certain tasks, which can significantly cut down on manual work. The objective is to find a tool that helps you analyze qualitative data more efficiently, not just one that offers every function imaginable.
Beyond Software: Setting Up for Success
No matter which software you choose, organizing your digital workspace effectively is crucial. This involves creating clear file naming rules, folder structures, and version control methods right from the start. Consider it like organizing a physical office before a major project; it helps prevent confusion and saves a lot of time later on.
Data security is another critical aspect, especially with the sensitive nature of much qualitative data, such as interview transcripts filled with personal accounts. Make sure any tool you use, or your personal storage system, has strong security features, including encryption and secure access controls, to safeguard participant confidentiality and meet privacy standards.
For projects involving teams, think about how a tool supports collaboration. Features like shared project access, the ability for multiple users to code simultaneously (with clear tracking of contributions), and tools for discussing interpretations can significantly improve teamwork. If your selected software doesn't have these, you'll need to establish clear external procedures for sharing work and resolving differences to ensure analytical rigor and consistency.
The Enduring Value of Analog Approaches
It's also vital to recall that technology isn't the only answer when learning how to analyze qualitative data. Sometimes, classic pen-and-paper methods, or whiteboards and sticky notes, can be extremely effective, especially in the initial phases of analysis. For example, physically arranging notes during an affinity diagramming session can ignite connections and insights that might not be as apparent on a screen. Many researchers find that initial brainstorming or thematic mapping with physical notes can be more fluid and creatively stimulating.
The most effective strategy often combines approaches: using digital tools for their efficiency in handling and coding large datasets, while also employing hands-on, analog techniques for deeper conceptual work. Ultimately, the ideal "tool" is one that sharpens your ability to think critically about your data, assisting you to analyze qualitative data in a manner that leads to genuine insight and significant findings.
Advanced Techniques That Reveal Deeper Insights
So, you've got the hang of basic coding in your qualitative analysis, but now you're looking to dig deeper than just spotting obvious patterns, right? If you're serious about understanding how to analyze qualitative data in a more profound way, there are some advanced analytical approaches that can help you build solid theoretical ideas. These methods aren't quick fixes; they require you to work closely and often repeatedly with your data, pushing past simple descriptions to uncover real explanations.
Choosing the Right Advanced Framework
Picking the best advanced method really comes down to what your research is asking and what you hope to learn. Not every framework is a good match for every kind of qualitative study; each provides a distinct way to look at your information.
- Thematic Analysis (Advanced Application): Sure, finding themes is a basic step, but applying this technique in an advanced way means you're interpreting things with more subtlety. You’ll be looking past what’s on the surface to uncover latent themes—those hidden ideas or assumptions. You might concentrate on the connections between themes, creating a detailed thematic map that clearly tells a story about what you're studying, which could even lead to new ways of thinking about it.
- Grounded Theory: This is a really effective framework if you want to develop theories straight from your data. It’s especially handy when current theories don’t quite fit or don't exist for what you're investigating. The process involves a lot of back-and-forth, collecting and analyzing data at the same time. You'll use methods like theoretical sampling (gathering data specifically to explore new concepts) until you hit theoretical saturation (when no fresh insights are coming through). The main objective is to create a solid theory that explains a process or action.
- Phenomenological Analysis: If your aim is to grasp the core of a lived experience from the viewpoint of those who went through it, phenomenological analysis is your go-to. This method tries to describe the shared meaning of experiences for several people regarding a particular idea. For instance, what's it really like for first-time entrepreneurs? Researchers using this often "bracket," or set aside, their own biases to concentrate solely on what participants describe.
Methods for Uncovering Nuance and Building Theory
Beyond these broad frameworks, there are specific methods you can weave in to add more depth and strength to your qualitative data analysis. These will guide you toward more developed interpretations.
- Cross-Case Analysis: This means you systematically compare and contrast information from several different cases (like different people, groups, or locations). By searching for patterns, similarities, and differences across these cases, you can spot wider trends that you might miss if you only looked at one case. This method is crucial for building more generalizable theories from qualitative findings.
- Negative Case Analysis: A key sign of thorough analysis is actively looking for and studying cases or examples that don't line up with your emerging patterns or theories. Instead of just ignoring these outliers, negative case analysis pushes you to adjust or rethink your explanations. This ultimately makes your findings more believable. For example, if most users found a new software feature easy to use, looking into the experiences of the few who found it confusing can offer vital insights for making it better and developing a more detailed theory of usability.
- Constant Comparison Method: This is fundamental to Grounded Theory but can be adapted for other approaches too. It involves continuously comparing new pieces of data with data you've already coded and with categories that are starting to form. Every new bit of information is checked against existing concepts, which helps to sharpen definitions, identify the characteristics of categories, and explore how they relate to each other. This ongoing comparison keeps your interpretations firmly rooted in the data.
From Description to Theory: Developing Models and Frameworks
What makes these advanced techniques so valuable is how they shift your analysis from just saying what's in your data to actually explaining the how and why behind it. This involves stepping back from the specific details to create theoretical models or conceptual frameworks. For example, your work might lead to a model showing the different stages people go through when they start using a new technology, or a framework that explains the main things influencing decisions in a certain situation.
After you’ve put together these more complex models, sharing them clearly becomes really important. It might sound a bit offbeat, but checking out different blogging tools can actually give you some neat ways to outline, structure, and even show off these detailed frameworks, perhaps before you share them in a more formal academic setting. In the end, getting skilled at how to analyze qualitative data using these more advanced methods means you can bring fresh knowledge and a richer understanding to your area of work.
Integrating Technology and Mixed Methods Approaches
Figuring out how to analyze qualitative data effectively goes beyond just knowing individual methods. Today's research frequently benefits from mixing different strategies and using new technologies. This combination can lead to a much richer, more detailed understanding than one method or data type could offer by itself. When you carefully blend these approaches and tools, your analysis can become truly meaningful.
This shift often involves bringing together the deep insights from qualitative work with the broad scope of numerical data. This effective pairing is the foundation of mixed methods research, a way of studying things that's becoming more and more important.
The Power of Mixed Methods Research
Mixed methods research is all about collecting and looking at both qualitative (word-based) and quantitative (number-based) data within a single study. The main idea is that these two kinds of data, when put together, give a fuller picture than either one could alone. For instance, a survey might show that 75% of users finish a certain task (quantitative), but then in-depth interviews (qualitative) can help you understand why the other 25% don't.
This method provides a solid way to grasp both the "what" (seen in statistical patterns) and the "why" (found in human experiences). The analysis of qualitative data is seeing new trends, and a major one is this very joining of quantitative and qualitative information. This allows researchers to get the best from both types of data, creating a well-rounded view of what they're studying. In public health, for example, understanding both statistical trends and personal stories is vital for creating good policies. Modern software now helps combine numerical figures with qualitative observations, improving the quality of research. Also, technologies like Virtual Reality (VR) and Augmented Reality (AR) are being used to gather qualitative data, creating immersive and controlled settings that can offer more genuine insights into behavior. Find out more about these developments.
Using Technology in Qualitative Analysis
Beyond just mixing data types, certain technologies are changing how to analyze qualitative data. AI-assisted tools, for instance, can greatly speed up the early stages of coding or finding themes in large amounts of text. It’s crucial, though, to see these tools as helpers that support your analytical abilities, not replace them. AI can spot patterns, but human researchers are essential for interpretation and understanding the context.
New tools offer several advantages:
- Automated transcription services can quickly turn audio recordings into text.
- AI-driven platforms can offer starting points for codes or analyze sentiment.
- VR/AR environments can be used for fresh data collection methods, such as watching interactions in simulated spaces.
The important thing is to pick technologies that genuinely make your work smoother or open up new ways to analyze, without making things overly complicated. Your own knowledge and judgment are still the most important parts of the process.
Maintaining Rigor and Ethical Considerations
While technology brings exciting new options, adding it to qualitative analysis means you need to be careful about thoroughness and ethics. Just using a new tool doesn’t guarantee your analysis will be better. The core principles of solid qualitative research—like transparency, a systematic approach, and self-reflection (reflexivity)—must always be your guide.
When using technology, particularly advanced systems like AI or VR, keep these points in mind:
- Watch out for potential biases: Algorithms in AI tools can have built-in biases, which might affect the patterns they find.
- Make data privacy and security a priority: New ways of collecting data can gather very sensitive information that needs strong protection.
- Get informed consent: Participants need to fully understand how their data will be gathered, looked at, and used, especially when immersive technologies are involved.
Making smart choices about which tools to use and how to use them is very important. For more details on different research and analysis types that can assist with these choices, check out this useful guide on Data Analysis Methods Research. In the end, the aim is to thoughtfully include technology to deepen the insights and trustworthiness of your qualitative findings. This careful balancing act ensures that new methods strengthen, rather than weaken, the quality of your research.
Building Credibility and Trust in Your Analysis
When you share insights from qualitative data, they're only as good as the trust people have in them. To make sure your findings are taken seriously and hold weight, particularly when you're figuring out how to analyze qualitative data, you need to show your work is thorough and reliable. It’s more than just spotting interesting trends; it's about showing these trends are solid and presented without bias.
Core Tenets of Trustworthy Analysis
A few core ideas make qualitative research believable. First, there's Transferability – this means your findings could apply to other situations or groups, a bit like generalizability in number-based studies.
Then, Dependability is all about consistency; if someone else did your study the same way, they should get similar results. Lastly, Confirmability focuses on objectivity, making sure your conclusions come straight from the data, not from your personal views.
Practical Strategies for Demonstrating Rigor
Putting these ideas into action means using certain methods as you do your research. A really important starting point is keeping careful track of how you conduct your analysis.
The Audit Trail: Your Analytical Footprint
Imagine an audit trail as your research diary. It’s where you write down every step, from your first notes on data collection to how you decided on your final themes. This log should include your coding choices, thoughts on new patterns you see, and why you made any changes to your methods.
A well-kept audit trail shows exactly how you worked, so others can see your thinking and understand your conclusions. This really helps build both dependability and confirmability.
Seeking Diverse Perspectives: Member Checking and Peer Debriefing
Getting fresh eyes on your work is another key tactic. With member checking, also known as respondent validation, you share your early findings with the people who participated in your study. Their input can show if you've understood things correctly, add more depth, or point out where you might have gone off track. Just like with surveys, getting good feedback here depends on asking the right questions; you might find some good ideas in this article on Top Survey Questions for Valuable Feedback.
You can also try peer debriefing. This means talking through your analysis and findings with colleagues or mentors who aren’t directly involved. They can offer different viewpoints, question your assumptions, and suggest other ways to look at the data you might have missed. This is a great way to boost confirmability and find any hidden biases in your work.
Addressing Biases and Dissenting Voices
It's really important to notice and handle your own biases when you analyze qualitative data. Reflexivity is the habit of looking closely at your own beliefs, background, and how you might be affecting the research. A good idea is to keep a journal to jot down your thoughts and any biases you spot as you go.
Also, don't ignore information that doesn't quite fit with your main ideas. Make an effort to find and look into these "negative cases." Instead of weakening your work, dealing with data that challenges your themes can actually make your findings much stronger. It shows you've looked at the data from all sides, which makes your conclusions more solid and trustworthy.
When you consistently use these methods, you create a solid base of trust for your qualitative analysis. This helps ensure that your insights are not just interesting, but also hold up under close examination. As a result, colleagues, stakeholders, and anyone interested in your research will have more confidence in what you've found.
Key Takeaways
Diving into qualitative data analysis can feel like a puzzle. With a good plan, you turn rich stories into valuable insights. This guide breaks down proven strategies, offering clear steps and benchmarks to help you master how to analyze qualitative data. These tips are for immediate use, whether you're new or a seasoned pro.
Laying a Solid Foundation for Analysis
A strong start is crucial. Before analyzing data, establish these fundamentals:
- Crystal-Clear Research Questions: Know what you want to find. Well-defined questions act as your compass, guiding analysis and keeping work focused. Ask "What are usability challenges with feature X?" not "What do users think?"
- Systematic Approach is Non-Negotiable: Qualitative data is varied, but your method must be rigorous. This means a consistent coding process and careful documentation. An audit trail is vital for transparency.
- Embrace Reflexivity: Consider your biases. Keeping a reflexive journal helps identify and mitigate influences on interpretation, improving objectivity.
Navigating the Core of Qualitative Analysis
With a solid foundation, interpret your data using these key strategies:
- Strategic Coding Practices:
- Start with open coding for broad exploration.
- Progress to selective coding to refine themes.
- Develop a detailed codebook, defining codes with examples for team consistency.
- Smart Tool Selection:
- Evaluate tools like NVivo (see the official NVivo site) or Atlas.ti (visit the official Atlas.ti site) for your project. AI can help with transcription.
- Don't forget analog tools (sticky notes, whiteboards) for brainstorming.
- Meticulous Data Management:
- Use clear file naming and folder structures early.
- Prioritize data security and participant confidentiality, especially with sensitive info.
Advancing Your Insights and Building Trust
Generate strong findings by moving beyond basic interpretation:
- Explore Advanced Analytical Lenses: For deeper understanding, consider:
- Thematic Analysis for patterns.
- Grounded Theory to develop theory from data.
- Negative Case Analysis by examining contradictions to strengthen conclusions.
- Establish Credibility Markers:
- Employ triangulation (multiple data sources/investigators).
- Use member checking (participant validation).
- Engage in peer debriefing for external perspectives. These boost dependability and confirmability.
Measuring Growth and Sustaining Momentum
Mastering how to analyze qualitative data is an ongoing journey. Track your improvement:
- Define Progress Indicators: What does "better" mean? (e.g., coding efficiency, interpretation depth, report clarity).
- Seek Feedback Regularly: Ask peers for input on coding, themes, or drafts.
- Celebrate Milestones: Acknowledge completed phases. Small datasets offer big wins; testing with just 5 users can uncover about 80% of usability issues. Recognizing this maintains motivation.
Consistently applying these takeaways will improve your qualitative analysis quality and build confidence in finding actionable insights.
Ready to gather rich qualitative data? BuildForm’s AI-powered forms make it easy to create engaging surveys, collect detailed feedback, and capture valuable insights—no code needed. See how DeepOptimize can automatically improve form completion rates. Start building smarter forms with BuildForm today!