Your dashboard says leads are up. Sales says pipeline quality is flat. Finance asks what marketing spend produced. Everyone is looking at the same funnel, but each team is reading a different story.
That disconnect usually starts with the wrong measurement system. Teams count form fills, celebrate lower CPL, and call the month a win. Then the quarter closes and nobody can explain why more leads didn't become more revenue. The problem isn't that lead generation metrics don't matter. It's that many organizations stop measuring too early.
A useful lead generation measurement system follows the lead all the way through the funnel. It starts with traffic and submissions, but it doesn't end there. It asks which channels produce qualified leads, how quickly those leads move, where people drop off inside forms, and which paths turn into customers. If you want a better read on that first conversion point, form analytics for lead capture is one of the clearest places to start.
Table of Contents
- Moving Beyond Vanity Metrics
- The Core Lead Generation Metrics You Must Track
- Connecting Metrics to Quality and Revenue
- How to Track Your Metrics in Practice
- Segmenting Metrics for Deeper Insights
- Building Your Lead Generation Dashboard
- How to Optimize Your Funnel Based on Your Metrics
Moving Beyond Vanity Metrics
Many organizations don't have a lead problem. They have a measurement problem.
A campaign can produce a record month for raw submissions and still fail. If those leads don't progress to MQL, don't get accepted by sales, or sit untouched in the CRM, the top-line lead count is mostly noise. That's why the central question in lead generation metrics isn't volume alone. As Boomerang argues in its discussion of lead generation challenges, most guides still over-focus on top-of-funnel counts while giving far less practical guidance on whether those leads become revenue.
The under-answered question isn't how many leads you got. It's which sources and qualification rules produced customers, and how quickly they moved.
That changes how you look at success. A paid social campaign that floods the CRM with low-intent leads may make marketing look busy while creating extra work for SDRs. A lower-volume channel can outperform it if the leads are better matched to your offer and reach sales in a usable state.
Vanity metrics aren't always useless. They're just incomplete. Total leads, form submissions, CTR, and CPL can all point to real issues. But on their own they don't tell you whether your funnel is healthy. They only tell you that people entered it.
Where vanity reporting breaks
Three failures show up again and again:
- Marketing reports only submissions: The dashboard stops at the thank-you page, so nobody sees what happened after handoff.
- Sales rejects leads informally: Reps know the lead quality is poor, but that feedback never becomes a tracked metric.
- Attribution stays shallow: Teams credit the last click, then keep spending on channels that generate activity instead of customers.
The fix is to connect top-of-funnel behavior to bottom-funnel outcomes. That means measuring the full path from visitor to lead, lead to qualified lead, qualified lead to customer, and customer back to source.
The Core Lead Generation Metrics You Must Track
A campaign can produce 500 form fills and still miss pipeline. I see this happen when teams track capture but ignore what the capture point is telling them. The right core metrics should tell you two things early: whether you are creating real buying intent, and where that intent is getting lost before sales can use it.
Start with three metrics at the point of conversion: lead volume, visitor-to-lead conversion rate, and cost per lead. Then add one operational metric that a lot of dashboards miss: form completion behavior, including drop-off by field and partial submissions. Without that fourth signal, teams often blame channel quality for a problem caused by form design, routing, or follow-up lag.
The four metrics that matter first
Lead volume is the count of new leads created in a given period. It sets the baseline for planning. Break it down by source, campaign, offer, landing page, and audience segment. A single total is too blunt to diagnose anything.
Benchmarks are only useful for context. In Databox's lead generation benchmark roundup, B2C companies averaged 196.5 new leads monthly, while B2B firms averaged 27. Analysts there also reported an average cost per lead of $198.44, and 61% of marketers said lead generation and conversion are their hardest challenge. Those numbers are a reminder to measure efficiency and fit together, not to set arbitrary volume targets.
Visitor-to-lead conversion rate shows how much of your traffic turns into captured demand. Use a simple formula: total leads divided by total relevant visitors. Track it by page and by source, not only sitewide. A paid campaign with a healthy click-through rate can still fail here if the landing page promise and the form experience do not match the ad.
Cost per lead, or CPL, measures acquisition efficiency. The formula is straightforward: total campaign spend divided by total leads generated. It matters because it lets teams compare channels on economics, not activity, and it helps teams build a predictable growth engine by tying acquisition cost back to the rest of the funnel.
Form completion behavior closes an important measurement gap. Track start rate, completion rate, abandonment by field, time to complete, and partial submissions. This is often the missing link between top-of-funnel effort and downstream quality. If people start the form but quit on company size, phone number, or budget, the problem may be qualification friction rather than weak traffic. If your form tool captures partial submissions, your team can see which campaigns are generating intent even when the submit button never gets clicked.
Core Lead Generation Metrics Cheat Sheet
| Metric | Formula | What It Tells You |
|---|---|---|
| Lead volume | Total leads generated in a period | Whether campaigns are producing enough raw demand to support pipeline goals |
| Visitor-to-lead conversion rate | Total leads / relevant website visitors | Whether traffic and landing pages are turning visits into captured demand |
| Cost per lead | Total campaign spend / number of leads | Whether a channel is acquiring leads at a sustainable cost |
| Form completion behavior | Starts, completions, partial submissions, field-level drop-off | Whether form friction or qualification logic is suppressing conversion before lead capture |
What these metrics help you diagnose
Patterns matter more than isolated numbers.
- High traffic, low visitor-to-lead conversion rate: Usually points to weak message match, poor page clarity, or a form asking for too much too soon.
- Strong lead volume with rising CPL: Acquisition is getting more expensive, often because channel efficiency is slipping or low-intent audiences are being pulled in.
- High form starts with low completions: The offer is working, but the form experience is blocking capture.
- A meaningful number of partial submissions: Buyers are showing intent, but friction, trust concerns, or timing are interrupting conversion. That is useful operational data, not noise.
- Low CPL paired with weak sales follow-up later: Cheap leads can still be expensive if they never become accepted opportunities.
These are the metrics I would put in place before arguing about attribution models. If the entry point is not measured correctly, downstream reporting gets distorted fast.
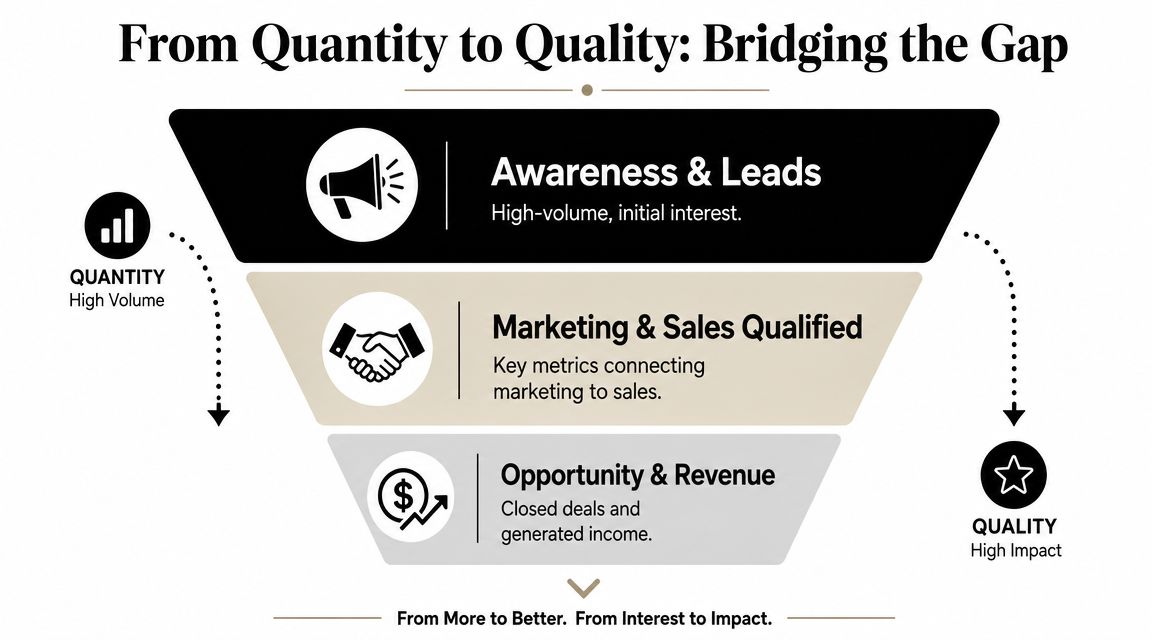
Connecting Metrics to Quality and Revenue
A campaign launches, form fills rise, and the weekly report looks healthy. Two months later, sales says the pipeline is thin, win rates are flat, and half the leads were never worth a call. That gap is usually a measurement problem, not a traffic problem.
Lead reporting has to follow the record past the form fill. A name captured on a landing page is only the first signal. The key question is whether that person becomes sales accepted, creates pipeline, and contributes to closed revenue.
Where marketing and sales lose the thread
The break usually happens between inquiry, qualification, and opportunity creation.
Marketing tracks lead volume and conversion rate. Sales looks at accepted leads, meetings held, pipeline created, and close potential. If those stages are not tied together at the contact and opportunity level, both teams can be right about their own numbers and still wrong about funnel health.
MQLs and SQLs still matter here, but only if the definitions are operational. An MQL should reflect a clear fit and intent threshold. An SQL should mean sales reviewed the lead and agreed it deserves active pursuit. If MQL volume rises while SQL rate falls, the problem is rarely solved by buying more traffic. The issue is usually weak targeting, inflated scoring, poor routing, or forms that collect too little context to qualify properly.
This is also where partial submission data becomes useful. A partial form is not revenue, but it is intent data. If high-fit buyers start a demo form, abandon at the budget or phone field, and never become MQLs, the funnel is losing quality before the CRM ever sees it. Teams that only measure completed submissions miss that failure point.
What to connect if you want revenue answers
A practical revenue view links five checkpoints:
- Lead to MQL rate: Are you capturing people who match your ICP and showing real buying signals?
- MQL to SQL rate: Does sales agree with marketing's quality threshold?
- SQL to opportunity rate: Are accepted leads turning into active pipeline?
- Opportunity to customer rate: Do those opportunities close?
- Revenue per lead by source: Which channels produce pipeline and closed-won revenue, not just cheap conversions?
These metrics work together. Looking at one in isolation leads to bad decisions. A paid channel can produce a high volume of leads at an acceptable CPL and still be a poor investment if SQL creation is weak. A lower-volume channel can look inefficient at the top of the funnel and still outperform because it creates qualified pipeline faster.
I usually want one more cut. Time to stage progression. If one source creates opportunities in 12 days and another takes 45, that difference affects forecast quality, follow-up design, and budget allocation.
Lead value starts with downstream conversion
Cheap leads create false confidence.
A better model assigns expected value to a lead based on what similar leads produce downstream. The basic approach is simple: connect source, campaign, form, and qualification inputs to opportunity creation, closed-won revenue, and sales cycle length. Then compare lead volume against pipeline generated, not against form fills alone.
That only works if the systems pass data cleanly. Source data has to persist from first touch into the CRM. Lifecycle updates have to sync back to reporting. Form fields need to map to usable properties instead of sitting in notes or free text. If your setup still breaks at handoff, a tighter CRM API integration workflow usually fixes more reporting problems than another dashboard layer.
What good qualification looks like in practice
Good forms collect enough information to improve routing and scoring without crushing conversion.
For a high-intent demo request, that often means company name, work email, role, and one or two qualifying fields tied to routing or fit. For a lower-intent asset, it may mean less friction upfront and progressive profiling later. The trade-off is straightforward. Every added field can improve lead scoring, but it can also reduce completion rate. That is why field-level abandonment and partial submissions matter. They show whether your qualification logic is improving lead quality or just blocking demand capture.
Use those signals to answer practical questions:
- Are enterprise prospects dropping on fields that small-business buyers complete?
- Are certain sources producing more partial submissions than completed forms?
- Does asking for phone number improve SQL rate enough to justify the lost conversions?
- Are routed leads reaching the right rep fast enough to preserve intent?
Those are revenue questions disguised as form analytics.
When teams connect top-of-funnel behavior to accepted pipeline and closed-won outcomes, the conversation changes. Lead generation stops being a volume contest. It becomes a system for finding where quality is created, where it leaks out, and which fixes will increase revenue.
How to Track Your Metrics in Practice
A common reporting failure looks like this. Marketing shows rising form submissions. Sales says lead quality is getting worse. Finance cannot tie either view to pipeline with confidence because the source data breaks the moment a visitor hits the form.
That usually comes down to tracking design, not dashboard design.
![]()
The minimum tracking stack
Use three connected layers.
Web analytics should capture source, landing page, session path, and the conversion events that happen before a lead exists in the CRM. GA4 is often the starting point because it handles traffic attribution and on-site behavior reasonably well if events are configured correctly.
Your CRM should own lifecycle stages, opportunity creation, revenue outcomes, and timestamps for key handoffs. Salesforce and HubSpot are common choices. If stage updates sit in spreadsheets, Slack threads, or rep notes, reporting will drift fast.
The capture layer needs more than a submitted or not-submitted event. It should pass UTM data, referrer, landing page, campaign context, form answers, and submission timing into the lead record. The quality of those handoffs often depends on how well your form system supports CRM and API integration workflows.
If one of those layers is weak, attribution breaks in predictable ways. Marketing gets credit for lead volume but not revenue. Sales rejects leads without a clean reason code. RevOps spends the month reconciling IDs across platforms instead of fixing funnel leaks.
What standard form tracking usually misses
Basic form tracking captures the final submit. That is the bare minimum.
It does not show where a prospect stalled, which field created resistance, whether mobile users dropped at a higher rate, or how many people started with real intent and never finished. Without that detail, teams guess. They blame traffic quality when the actual problem is a routing field, a phone-number requirement, or a form that becomes painful on smaller screens.
That gap matters because the form is where anonymous traffic becomes an identified lead. If tracking gets thin at that moment, top-of-funnel activity and bottom-funnel revenue stay disconnected.
BuildForm is one example of a capture layer built for that problem. It supports conversational forms, conditional logic, real-time analytics, and partial submission tracking. The useful part is not the format. It is the ability to see where intent appeared, where friction interrupted it, and whether those contacts later turned into qualified pipeline.
Track these behaviors inside the form layer:
- Completion rate: Measures whether the form experience converts the traffic you paid to acquire.
- Field-level drop-off: Shows which questions create hesitation, confusion, or unnecessary friction.
- Partial submissions: Captures incomplete but high-intent sessions that would otherwise disappear from reporting.
- Routing outcomes: Confirms whether qualified leads reached the right owner, queue, or workflow without delay.
The practical goal is simple. Follow the record from click to form start, from form start to submission or partial capture, from capture to CRM stage progression, and from stage progression to revenue. Once those links are in place, funnel diagnosis gets much more precise. You can tell whether a campaign is attracting the wrong audience, whether the form is filtering too aggressively, or whether sales follow-up is where conversion breaks.
Segmenting Metrics for Deeper Insights
Aggregate reporting makes weak channels look healthy and strong channels look expensive.
If you only review overall CPL, overall conversion rate, and total lead volume, you'll miss the reasons performance changes. A blended dashboard hides too much. One campaign can be carrying the month while another wastes budget.

Why aggregate reporting hides the real story
Start by segmenting lead generation metrics across four dimensions:
- Channel: Organic search, paid search, paid social, referral, partner, email.
- Campaign: Specific offers, ad sets, landing pages, webinar promos, demo campaigns.
- Device: Mobile and desktop often behave differently, especially on multi-step forms.
- Geography or market: Useful when lead qualification varies by region, language, or sales coverage.
Often, teams discover that the "worst" channel by CPL is the best channel by sales acceptance. Paid search may cost more per lead than social, for example, yet produce cleaner handoffs and faster opportunity creation. Social may drive more submissions but weaker downstream progression.
That kind of insight only appears when you segment past the first conversion event. You need source-to-MQL, source-to-SQL, and source-to-customer views, not just source-to-form-fill.
Segment first, then judge performance. Blended numbers reward channels that create activity, not channels that create customers.
A short walkthrough can help frame the concept:
- Pull lead volume by source. This tells you who is creating the most entries into the funnel.
- Add qualification rates. Which sources produce accepted leads instead of rejected ones?
- Layer in close data. Which sources become revenue?
- Compare cycle speed. A slower but higher-quality source may still deserve investment. A fast but low-converting source may need tighter qualification.
Later in the review cycle, use this video to align the team on analysis habits and reporting discipline:
How attribution changes the conclusion
Attribution model choice can change which channel looks successful.
A first-touch model favors discovery. A last-touch model favors conversion actions. A more distributed approach gives credit across the journey. None is universally correct. What matters is choosing a model that matches the buying motion and then reading it with discipline.
For lead generation metrics, attribution should answer two practical questions:
- Which channel introduced buyers who eventually closed?
- Which channel helped push already-interested buyers into conversion?
If you only reward the last touch, teams often over-invest in channels that harvest existing demand. If you only reward first touch, they can under-value channels that capture decision-stage intent. Segmented reporting helps keep both effects visible.
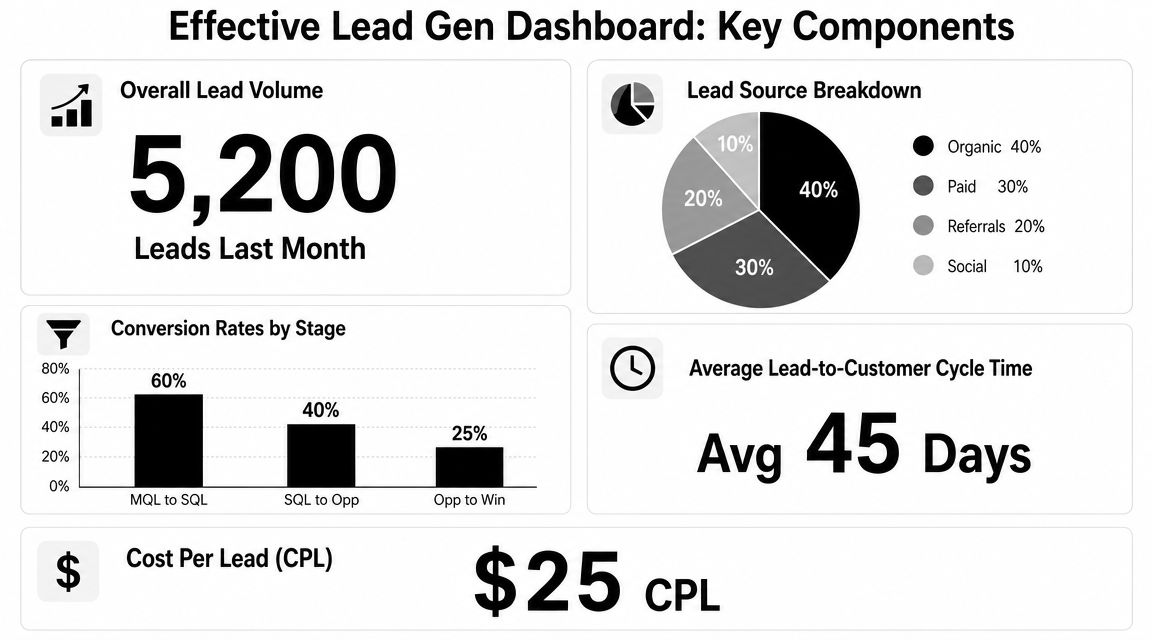
Building Your Lead Generation Dashboard
Most dashboards fail because they try to answer every stakeholder's question at once.
The result is clutter. Marketing sees too much sales detail. Sales doesn't trust the top-of-funnel charts. Leadership gets trapped in channel metrics without a clear read on revenue impact. A strong lead generation dashboard is role-based. Same system, different views.
What marketing needs to see daily
A marketing manager needs diagnostic speed. The dashboard should answer where leads are coming from, whether pages are converting, and whether acquisition cost is moving in the wrong direction.
That view usually includes:
- Lead volume by source and campaign
- Visitor-to-lead conversion rate by landing page
- CPL by channel
- Form completion trends
- MQL creation by source
This is the layer where tactical decisions happen. Pause underperforming campaigns. Rewrite offers. Adjust audience targeting. Shorten a form. Improve page-message match. If your team is designing reporting layouts, these survey dashboard examples are a useful reference for how to make metric views easier to scan.
What sales and leadership need instead
Sales leadership needs a different picture. They care less about how many people clicked and more about whether the leads handed over were usable.
For a head of sales, the dashboard should surface:
- MQL to SQL progression
- SQL volume by source
- Lead response and routing consistency
- Opportunity creation by source
- Sales-cycle length by segment
The CEO or RevOps lead needs one level higher. This view should connect spend, pipeline, and outcomes without drowning in channel detail. Include revenue-linked measures such as:
- Lead-to-customer trend
- Pipeline contribution by source
- ROI view tied to closed business
- Trend lines on qualification quality
- Exceptions and funnel leaks that need executive attention
Dashboards should reduce debate, not create more of it. If three teams leave a review meeting with three different interpretations, the dashboard isn't doing its job.
One practical pattern works well. Give each stakeholder a primary tab they own, then keep a shared funnel tab that uses the same stage definitions across teams. That prevents the classic problem where marketing reports MQL success while sales reports pipeline failure from a different dataset.
How to Optimize Your Funnel Based on Your Metrics
Good lead generation metrics only matter if they change behavior.
The fastest way to operationalize them is to use an if-this-then-that approach. Don't admire the dashboard. Use it to decide what to fix next.
If the issue is volume
If traffic is healthy but lead volume is weak, review the offer and the conversion path before you buy more traffic. Tighten page-message match, simplify the CTA, and remove unnecessary fields from the first capture step.
If form starts are strong but completion is weak, inspect field-level drop-off and partial submissions. That usually points to friction inside the form, not a traffic problem. Mobile users are often the first group to expose this.
If the issue is qualification or conversion
If MQL volume is high but SQL acceptance is weak, revise your scoring rules with sales. Stop passing curiosity as buying intent. Add conditional questions that separate fit from casual interest without making the form unnecessarily long.
If CPL looks efficient but lead-to-customer performance is disappointing, shift budget based on downstream conversion, not front-end cost. This same logic shows up in other marketplaces too. Teams that have optimized my listings on Amazon know that more clicks or impressions don't mean much if the listing doesn't convert profitable buyers.
If lead-to-customer movement is slow, inspect routing, response timing, and handoff criteria. Many funnel leaks aren't caused by poor acquisition. They're caused by lag between capture and follow-up.
A disciplined team uses metrics to isolate one constraint at a time. Fix the page when conversion is weak. Fix qualification when sales rejects leads. Fix routing when good leads stall. That's how lead generation becomes a revenue system instead of a reporting exercise.
Build a measurement system that follows the lead from first click to closed revenue, and your optimization decisions get much simpler. If you need a form layer that helps expose drop-off, partial submissions, and qualification friction while feeding that data into the rest of your stack, BuildForm is worth evaluating as part of that workflow.