
Beyond the Smiley Face: Surveys That Drive Growth
Customer satisfaction affects revenue. Consistent service increases repeat purchase behavior, but a survey only helps if it captures the right signal at the right moment and routes it to someone who can act on it.
Teams rarely fail because they lack question ideas. The failure usually happens in execution: sending an NPS survey after a support interaction, piling open-text prompts onto a transactional form, or collecting low scores with no owner, SLA, or follow-up path attached. Survey strategy matters more than clever wording.
Good programs are built around operations, not forms. The survey should match the touchpoint, stay short enough to earn completion, and trigger a clear next step based on the response. A low rating might create a recovery task for Customer Success. A positive score might prompt a referral or review request. Mixed feedback often belongs in product, support QA, or account planning.
That same principle applies to form design. A strong customer feedback form example is not just well written. It uses conditional logic, keeps unnecessary questions hidden, and passes clean data into Slack, your CRM, and ticketing workflows.
These eight customer satisfaction survey examples are organized around that operating model. Each one covers when to use it, what trade-offs to expect, which follow-up logic works in practice, and how BuildForm can turn responses into measurable action instead of another static dashboard.
Table of Contents
- 1. Net Promoter Score NPS Survey Template
- 2. CSAT Customer Satisfaction Score Survey Template
- 3. CES Customer Effort Score Survey Template
- 4. Multi-Dimensional Satisfaction Survey Template
- 5. Post-Purchase Customer Satisfaction Survey Template
- 6. Customer Effort Score CES Plus Open Feedback Hybrid Template
- 7. Transactional or Moment-in-Time Survey Template
- 8. 360-Degree Customer Health Scorecard Template
- Customer Satisfaction Survey Templates: 8-Way Comparison
- From Data to Decisions Activating Your Feedback
1. Net Promoter Score NPS Survey Template

NPS remains one of the most widely used loyalty metrics because it is easy to standardize, easy to trend, and easy to operationalize. Bain & Company introduced NPS in 2003 around a single question: “How likely are you to recommend our company/product to a friend or colleague?” Responses use a 0 to 10 scale, with Promoters scored as 9 to 10, Passives as 7 to 8, and Detractors as 0 to 6.
That simplicity is the strength and the limitation.
NPS works well for relationship health. It works poorly as a root-cause tool unless the follow-up logic is designed properly. Teams that stop at the score get a dashboard. Teams that branch intelligently get an action queue.
Use NPS when the customer has enough context
Timing matters more than wording here. Sending NPS right after signup usually measures expectation, not experience. Sending it right after a support ticket usually measures service recovery, not overall loyalty. Better trigger points are after onboarding is complete, after the customer reaches a meaningful usage milestone, or on a recurring quarterly or biannual cadence for account-based relationships.
Product-led companies often run NPS in-app after repeated feature use. Sales-led and account-led teams usually tie it to lifecycle stages or business reviews. Both approaches can work. The trade-off is comparability versus relevance. A fixed cadence makes trend lines cleaner. Event-based timing often produces more accurate sentiment because the customer has recent context.
A practical NPS template looks like this:
- Core question: “How likely are you to recommend us to a friend or colleague?”
- Promoter follow-up: “What do you value most?”
- Passive follow-up: “What is missing or not strong enough yet?”
- Detractor follow-up: “What should we fix first?”
The branching matters. Promoters tend to give usable advocacy language. Passives usually reveal missing value. Detractors point to broken parts of the experience, but only if the prompt is specific enough to produce a clear answer.
Build the survey around decisions, not reporting
The operational design should sit behind the template from day one. In BuildForm, I would place the score question first, then use conditional logic to route each respondent into a different path. Promoters can see a short follow-up plus an optional review or referral ask. Passives should get one diagnostic question focused on gaps, expectations, or competitive alternatives. Detractors should get a short text field, a reason-code selector, and an internal escalation path.
That escalation path is where NPS becomes useful. Low scores should not disappear into a monthly slide deck. Route them by webhook into Slack, assign an owner in the CRM, and create a follow-up task with a due date. If the account is high value, notify the CSM or support lead immediately. If the response mentions billing, implementation, or product bugs, tag the record so the right team sees a pattern instead of a one-off complaint.
I also recommend storing three fields alongside the score: account segment, lifecycle stage, and customer owner. Without those fields, teams can calculate NPS but struggle to act on it. With them, you can separate “new customer confusion” from “enterprise feature gap” and prioritize correctly. If you need a starting point for the structure, this example of a customer feedback form shows how to keep the form short while still collecting usable context.
What good NPS programs do differently
Strong NPS programs treat the score as a routing mechanism. They do not ask every customer the same open-ended question, and they do not send the same follow-up to every segment. A promoter in a mature account can be asked for a testimonial or case study interest. A promoter in an early-stage account may be better suited for a quick “what almost stopped you from adopting us?” prompt, because that feedback still helps product and onboarding teams.
Detractor handling needs the same discipline. Some responses need recovery. Others need categorization. If every low score triggers a manual outreach, teams burn time on accounts that were never a fit. If no low score triggers outreach, preventable churn slips through. The right rule set depends on contract value, customer tier, and whether the issue is fixable in the near term.
Used this way, NPS stops being a vanity benchmark and starts acting like an operating system for loyalty feedback.
2. CSAT Customer Satisfaction Score Survey Template
CSAT is one of the fastest ways to catch experience problems before they turn into churn, repeat contacts, or lost conversion. It measures satisfaction with a specific interaction, usually on a 1 to 5 scale from very unsatisfied to very satisfied. The standard calculation is straightforward: divide the number of satisfied responses by total responses, then multiply by 100. If 80 out of 100 respondents select 4 or 5, CSAT is 80%.
Benchmarks vary by channel, journey stage, and customer expectation. A support team handling complex technical issues may operate with a different target than an ecommerce team surveying delivery or checkout. That is why CSAT works best as an operational metric tied to a defined touchpoint, not as a universal company-wide score.
Place CSAT at the moment where action is still possible
Timing drives data quality. Send the survey too late and the score starts reflecting general brand sentiment, memory decay, or the outcome of follow-up steps that happened after the interaction. Send it too early and customers may not know whether the issue was resolved.
Good CSAT programs map the question to the decision window. After a support conversation, ask once the case is closed. After checkout, ask after payment confirmation. After onboarding setup, ask after the user completes the task you wanted them to finish.
A simple template works well:
- Primary rating: “How satisfied are you with this experience?”
- If score is 1 to 2: “What went wrong?”
- If score is 3: “What could we improve?”
- If score is 4 to 5: “What worked well?”
That branching matters because different scores need different follow-up. Low scores should produce diagnostic detail. Mid-range scores usually reveal preventable friction. High scores often surface what your team should standardize.
The real value of CSAT is in the routing logic
Strong CSAT execution does not stop at collection. It classifies responses, routes them, and triggers the next step while the interaction is still recoverable.
For example, a low CSAT after support can create a follow-up task for a team lead if the account is high value, but only tag the issue for weekly review if the customer is low tier and the comment points to a known limitation. A neutral score after onboarding can trigger a short second question about setup clarity, role permissions, or missing integrations. A high score after delivery can feed a review request sequence, but only after checking that no return or complaint was filed in the next few days.
That trade-off matters. If every low score gets white-glove outreach, teams waste time on feedback they cannot realistically resolve. If no low score gets routed fast, service failures sit in a dashboard until the account is already gone.
How to set this up in BuildForm
BuildForm is useful here because CSAT usually needs conditional logic, hidden fields, and downstream actions, not just a rating question. Capture the touchpoint ID, channel, product line, and owner alongside the score so teams can filter by the part of the journey that specifically needs work.
A practical BuildForm flow looks like this:
- Show the CSAT rating immediately after the interaction
- Pass metadata such as ticket ID, order ID, or onboarding stage into hidden fields
- If the score is low, open a required text field and tag the response for recovery
- If the score is high, ask an optional “what worked well?” question and pass the response to marketing or QA
- Send responses into the CRM, help desk, or Slack based on score, segment, or account value
For BuildForm users, post-form submission CSAT is especially useful. If a lead completes the form but rates the experience poorly, that is a conversion warning, not just feedback. Branch low ratings into a short diagnostic, capture where the friction occurred, and send that data to the team responsible for the form step, traffic source, or device experience.
Used well, CSAT gives teams a clear operating signal: what happened, where it happened, who owns the fix, and whether the customer needs recovery now.
3. CES Customer Effort Score Survey Template
Customers rarely complain about effort in the language teams use internally. They say, “I had to do this twice,” “I couldn't find the right option,” or “support kept sending me in circles.” CES captures that friction directly. It asks whether the task felt easy to complete, which makes it far more useful than a generic satisfaction question when the goal is to remove obstacles from a specific journey step.
The standard prompt is simple: “[Company] made it easy for me to complete this task.” Use a 1 to 5 or 1 to 7 agreement scale and keep the context specific. “Complete this task” works better when the survey is tied to one action such as resetting a password, resolving a support issue, checking out, or finishing setup.
Effort is a better operating metric when the goal is speed and completion
CES works best in journeys where the customer is trying to finish something with as little friction as possible. Support is a clear fit. So are onboarding flows, account changes, returns, claim submissions, and self-service help journeys. In these moments, “easy” is often a better predictor of repeat use than “satisfying.”
That is the trade-off.
CES gives cleaner diagnostic data, but it tells you less about loyalty or brand affinity than NPS. It also says less about the emotional quality of an interaction than CSAT. That is not a weakness if you use it for the right job. CES is a process metric. Use it where the team needs to identify where customers slow down, repeat steps, or ask for help they should not need.
A practical question set stays tight:
- Core CES question: “[Company] made it easy for me to complete this task.”
- If score is favorable: “What made this easy?”
- If score is unfavorable: “Where did the process become difficult?”
- Optional diagnostic question: “What should we remove, simplify, or explain better?”
How to structure CES so the data is usable
The biggest implementation mistake is collecting a score without enough context to act on it. If a customer reports high effort, the team needs to know which journey, which channel, which device, and which owner should investigate.
In BuildForm, pass metadata into hidden fields before the survey loads. Capture fields like touchpoint name, ticket ID, product plan, device type, support queue, or onboarding stage. Then branch the follow-up based on the score. If the score is low effort, ask for a short optional explanation you can mine for proof points or training examples. If the score is high effort, show a structured reason list first, then an open text field.
That sequence matters. A reason list gives you reporting consistency. Open text gives you the specific failure mode. Used together, they help teams separate “unclear instructions” from “broken form field” from “had to contact support to finish.” If you need a cleaner setup, this guide on creating feedback forms that capture actionable context is a good starting point.
Recommended BuildForm logic flow
A CES survey should feel short to the customer and detailed to the team receiving the response. One practical flow looks like this:
- Trigger the survey immediately after the task is completed or abandoned
- Pass journey metadata into hidden fields
- Ask the CES question first, before any open text
- If the score is positive, show one optional “what made this easy?” field
- If the score is negative, show a required friction category list
- If the respondent selects “other” or gives a very low score, open a required text field
- Route responses by friction type to the team that owns the fix, such as product, support ops, checkout, or onboarding
CES moves beyond a mere score, transforming into a routing system for friction removal.
Where CES creates measurable value
Use CES when the business outcome is tied to completion rate, time to resolution, repeat contact volume, or drop-off reduction. If checkout effort falls, conversion often improves. If support effort falls, repeat tickets and handle time often improve. If onboarding effort falls, activation usually gets easier to defend with data.
The score alone will not get you there. The operating model does. Tag the response, send it to the right queue, review patterns weekly, and track whether the same friction reason declines after a process change. That is how CES moves from survey reporting into workflow improvement.
Used well, CES gives teams a sharper question than “Were customers happy?” It tells them where the journey asked for too much work, and what to fix first.
4. Multi-Dimensional Satisfaction Survey Template
A single score can hide the underlying problem. A customer may love the product, dislike support, feel neutral about pricing, and struggle with setup. If you only ask one broad satisfaction question, you end up with a decent average and no operational clarity.
That's when multi-dimensional surveys earn their place. They break satisfaction into a small set of factors such as product quality, support, ease of use, delivery, and value for price. Salesforce, Amazon Prime, HubSpot, and Slack all fit this model when they need a broader read on the customer relationship.
When one score hides the real problem
This format is especially useful in quarterly reviews, post-renewal analysis, or after a complex purchase journey. It helps teams find the dimension that's dragging the experience down instead of guessing from anecdotal feedback.
A solid structure usually includes:
- Product dimension: satisfaction with product quality or reliability
- Support dimension: satisfaction with support quality
- Ease dimension: satisfaction with usability or onboarding
- Value dimension: satisfaction with value for price
- Optional segment-specific dimension: integrations, shipping, implementation, or API experience
A broad survey without segmentation creates false confidence. You get a clean average and still miss the broken part of the journey.
How to keep it from getting bloated
The trade-off is fatigue. Once these surveys pass a sensible length, completion quality drops. Keep only the dimensions your teams can own. If no one can act on a score, remove that question.
For SaaS and ecommerce brands, I usually recommend dynamic branching by customer type. Developers don't need shipping questions. Retail buyers don't need API satisfaction. BuildForm's conditional logic is a good fit for this because you can show only the dimensions that match the respondent's segment, lifecycle stage, or product tier. If you're setting up that branching structure, this guide on how to create feedback forms is the right internal reference.
The reporting should also mirror ownership. Product gets product themes. Support gets support themes. CX or Success owns the cross-functional patterns. If everything rolls into one dashboard, nobody knows what to fix first.
5. Post-Purchase Customer Satisfaction Survey Template
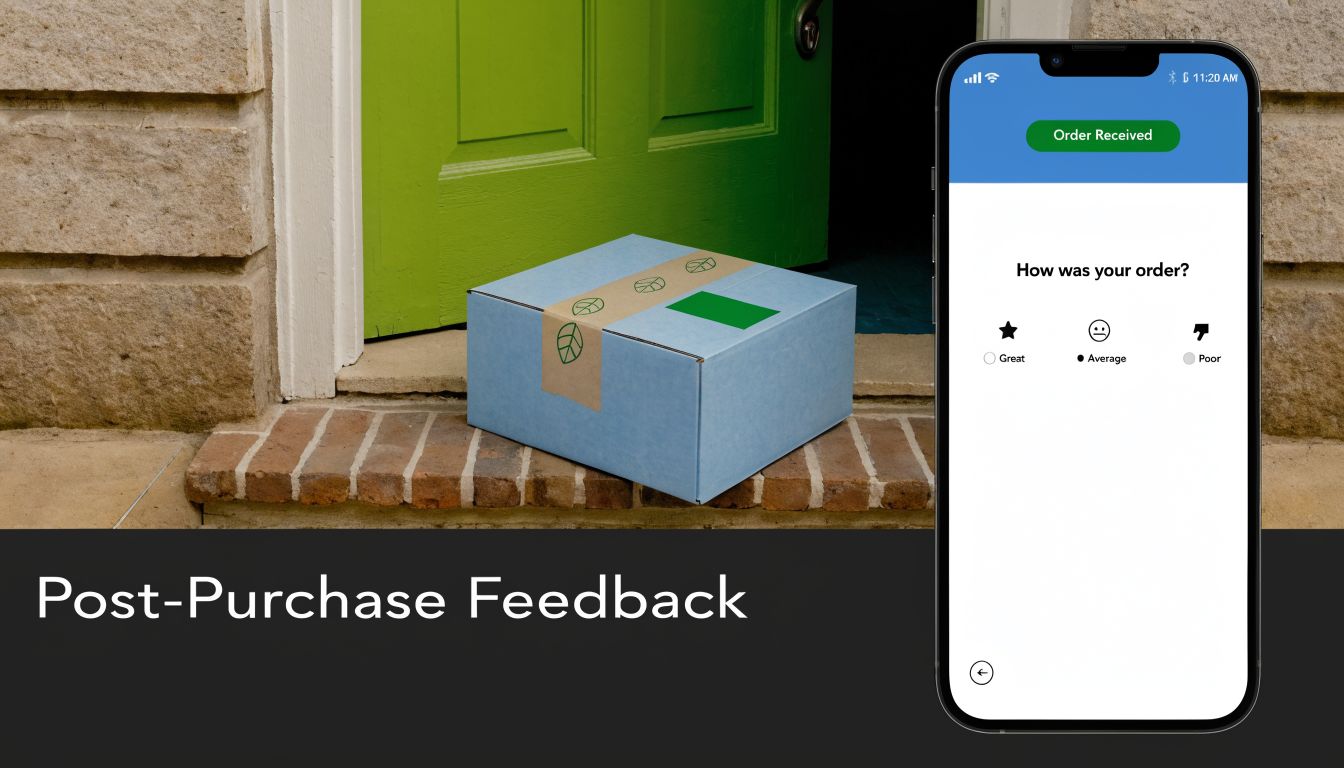
A post-purchase survey carries more operational value than a generic satisfaction check because it sits close to revenue, fulfillment, returns, and review generation. For ecommerce teams, one survey can tell you whether the problem started in checkout, shipping, product quality, or expectation-setting on the product page. That distinction matters because each issue belongs to a different team.
The survey should follow the actual order journey, not a generic CX template. Warby Parker, Glossier, Dollar Shave Club, and Shopify app developers all need different follow-up paths because the causes of dissatisfaction differ. A delayed package needs a different recovery motion than a product that arrived on time but failed to match the listing.
Build the flow around trigger timing and ownership
Send the survey after delivery and after the customer has had enough time to use the product. If it goes out too early, responses reflect shipping status instead of product satisfaction. If it goes out too late, recall gets weaker and the operational window for fixing the issue narrows.
A practical flow looks like this:
- Order experience: “How satisfied were you with the purchase process?”
- Delivery experience: “How satisfied were you with shipping and delivery?”
- Product experience: “How satisfied are you with the product you received?”
- Conditional follow-up: “What went wrong?” only if delivery or product scores fall below your threshold
- Recovery or advocacy branch: low scorers go to service recovery, high scorers can be routed to a review or referral request
That last branch is where teams either create action or collect dead data.
In BuildForm, this works well with order-status triggers and hidden fields pulled from Shopify or your order system. Pass in SKU, product category, order value, shipping method, and first-time versus repeat-buyer status. Then use conditional logic to ask apparel buyers about fit, subscription buyers about delivery cadence, and high-value customers about packaging or setup. If you need a cleaner structure for that logic, BuildForm's guide to survey design best practices is a useful reference.
Use segmentation to make the results usable
Headline scores hide expensive problems. A luxury product line and a discount line can post similar averages while failing for completely different reasons. Segment results by SKU family, carrier, region, discount usage, and new versus repeat customers. That gives operations, merchandising, and CX teams something specific to fix.
The reporting model should match the decision model. Shipping complaints go to logistics. Product mismatch themes go to merchandising or product. Packaging issues go to fulfillment. Review requests should only fire for satisfied buyers, not everyone who completed the form. That protects brand trust and gives the survey a clear job beyond measurement.
6. Customer Effort Score CES Plus Open Feedback Hybrid Template
Support teams can spot friction fast. They usually struggle with the next step, turning a low effort score into a fix the product, operations, or CX team can ship. That is why the CES plus open feedback hybrid works so well. It measures effort at the moment it happens, then captures enough context to assign the issue to an owner.
I use this format when a team knows a journey feels harder than it should, but the failure point is still unclear. Onboarding, password reset, checkout, plan changes, returns, and support resolution are strong use cases because the customer is trying to complete a specific task, not give a broad brand opinion.
Use the score to route the response
The survey should start with one CES question, then branch based on the score. Keep the logic tight so every answer has a clear operational purpose.
A practical flow looks like this:
- High effort branch: “What made this difficult today?”
- Mid-range branch: “What nearly got in your way?”
- Low effort branch: “What helped this feel easy?”
This structure improves response quality because the follow-up matches the experience the customer just had. It also makes coding easier later. High effort answers usually point to blockers, mid-range answers reveal avoidable friction, and low effort answers surface the steps worth preserving.
Operator note: Do not ask every respondent the same open question. A customer who had an easy experience will often manufacture a minor complaint if prompted to suggest improvements.
Build the workflow around action, not collection
The trade-off with open text is obvious. You get richer context, but you also create review work. The fix is to design the survey so the text can be routed immediately.
In BuildForm, this hybrid works well as a multi-step flow with conditional logic and hidden fields from the source system. Pass in event type, account tier, device, support queue, order value, or product area. Then trigger different tags based on both the score and the language in the response. A low CES after onboarding can open a success follow-up task. A low CES after checkout should go to ecommerce or payments. A low CES after ticket resolution belongs with support leadership, especially if the comment points to policy, wait time, or agent handoff.
Mobile completion matters here. As noted by SurveyMonkey in its overview of customer satisfaction survey questions, in surveys conducted during 2025, more than 60% of responses came from mobile devices, and non-responsive forms saw materially higher drop-off rates (SurveyMonkey). For CES programs, that matters because customers often respond in the same channel and context where the friction happened.
A one-question-at-a-time format helps for that reason. BuildForm can capture partial submissions, so if someone answers the CES prompt and leaves one short comment before dropping, the team still gets usable diagnostic data. That is a better outcome than losing the entire response because the form required completion on one long page.
Used well, this template does more than describe effort. It gives each low-score response a route, an owner, and a realistic chance of becoming an operational fix.
7. Transactional or Moment-in-Time Survey Template
Customers are far more likely to answer when the survey arrives in the same moment as the experience. That timing matters more than clever wording. A survey sent right after checkout, ticket resolution, onboarding completion, or first feature use captures a cleaner signal because the customer is reacting to one event, not trying to remember a week of interactions.
That makes this template operationally useful.
Transactional surveys work best when each one has a single job. Measure the quality of a specific interaction, identify whether recovery is needed, and route the response to the team that can fix the issue. If the survey starts asking about pricing, brand perception, roadmap fit, and support quality all at once, the data gets harder to act on.
A practical template usually stays tight:
- Event-specific rating question: use CSAT for satisfaction with a completed interaction, or CES if the event involved friction, such as support, checkout, or setup
- Conditional open-text follow-up: ask what went wrong for low scores, or what could have made the experience easier for middle scores
- Optional recovery field: ask whether the customer wants a follow-up, especially for service failures or high-value accounts
The logic matters as much as the questions. For example, after a support ticket closes, a positive score can end the flow immediately. A neutral score can trigger a short comment prompt. A low score should open a comment field plus a follow-up permission question, then pass ticket ID, queue, agent, and account value into the response record. That gives support leaders enough context to act without asking the customer to repeat the story.
BuildForm is useful here because the trigger and routing rules can sit close to the form itself. Send the survey from a webhook, CRM update, order event, or support status change. Then map response paths to actions. Low scores after delivery can create an operations task. Repeated low ratings tied to one feature can tag product. Poor scores from enterprise accounts can alert the customer success owner immediately.
Brevity still wins, but there is a trade-off. Shorter forms increase completion rates, while slightly richer logic gives better diagnostic value. The balance I recommend is one scored question for everyone, one conditional follow-up for respondents who signal friction, and one internal routing rule set behind the scenes. That is usually enough to capture the moment and turn feedback into a case, alert, or trend your team can work on.
A transactional survey should never end as a dashboard entry. It should create ownership.
8. 360-Degree Customer Health Scorecard Template
A single survey score rarely explains why an account renews, expands, or goes quiet. For strategic accounts, the useful view is a health scorecard that combines customer sentiment with operational signals your team already tracks.
This template works best for enterprise SaaS, managed services, and any recurring-revenue model where multiple stakeholders shape the relationship. One champion may love the product while admins are struggling, support has an open escalation, and procurement is questioning value. A one-question survey misses that tension.
Health scorecards belong in account strategy
Use this format on a fixed cadence, before renewal, or after a major change such as rollout, pricing updates, or executive sponsor turnover. The goal is not more feedback. The goal is a score your customer success, support, product, and sales teams can act on without debating what it means.
Keep the survey portion tight, then join it with behavioral data from your systems.
Common scorecard inputs include:
- Loyalty signal: NPS or recommendation likelihood from a decision-maker
- Experience signal: satisfaction with recent support, onboarding, or service interactions
- Product fit signal: confidence that the product still matches current needs
- Value signal: perceived ROI, efficiency gained, or value relative to price
- Risk signal: open-text concerns about blockers, unresolved issues, or renewal hesitation
The trade-off is real. Add too many scored questions and response rates fall. Keep it too thin and account teams get a vague score with no diagnostic value.
How to structure the survey so teams can use it
I recommend building the scorecard around roles, not just accounts. Send one version to executive sponsors focused on value and renewal confidence. Send a shorter operator version to daily users focused on usability, support, and adoption friction. Then weight the responses differently in the account-level score.
Conditional logic matters here. If an executive gives a low value score, open a follow-up asking what has changed since the last review. If an admin reports poor product fit, ask which workflow is breaking down and whether the issue is new or ongoing. In BuildForm, those branches can write directly to account fields, tag the response by stakeholder type, and trigger the right owner instead of dumping everything into one CX inbox.
That is what makes a health scorecard operational rather than decorative.
What to include and what to leave out
Use surveys to capture perception. Use your product analytics, CRM, billing system, and support platform to capture behavior. The strongest scorecards separate those jobs clearly.
A practical model might combine survey sentiment with login frequency, feature adoption, unresolved tickets, time-to-value milestones, and renewal date proximity. That gives teams a fuller read on account health without forcing customers to answer questions you already know. As noted earlier, loyalty and satisfaction signals are useful, but they become much more reliable when read alongside usage and service history.
Health scoring only works when each weak area has an owner, a threshold, and a next action.
If product fit drops below target, route it to the CSM and product owner. If value sentiment falls for a high-ARR account, create a save-plan task before renewal risk shows up in the forecast. If support satisfaction is low across several contacts in the same account, flag it as an account-level issue rather than treating each response as an isolated case.
That discipline is the difference between a scorecard that looks good in QBR slides and one that actually helps reduce churn.
Customer Satisfaction Survey Templates: 8-Way Comparison
| Template | Implementation Complexity 🔄 | Resource Requirements ⚡ | Expected Outcomes ⭐📊 | Ideal Use Cases 💡 | Key Advantages |
|---|---|---|---|---|---|
| Net Promoter Score (NPS) Survey Template | Low 🔄, single question, easy automation | Low ⚡, minimal setup, basic reporting | High ⭐📊, loyalty signal, benchmarkable but shallow diagnosis | SaaS growth, post-onboarding, loyalty tracking | Brevity, high response rates, easy benchmarking |
| CSAT (Customer Satisfaction Score) Survey Template | Very low 🔄, single-touch Likert | Low ⚡, trivial to embed in workflows | Medium ⭐📊, immediate interaction satisfaction, not predictive of loyalty | Support teams, checkout, post-chat feedback | Fast deployment, clear pass/fail metric for touchpoints |
| CES (Customer Effort Score) Survey Template | Low–Medium 🔄, single-statement task focus | Low–Medium ⚡, simple to run; needs clear task definition | High ⭐📊, strong predictor of retention when task-specific | Onboarding, checkout, support resolution, UX testing | Highlights friction points; actionable for UX/product changes |
| Multi-Dimensional Satisfaction Survey Template | High 🔄, many dimensions, branching | High ⚡, longer surveys, statistical analysis | Very High ⭐📊, deep diagnostics and correlation insights | Enterprise reviews, strategic product planning, renewals | Comprehensive drivers analysis; supports targeted roadmaps |
| Post-Purchase Customer Satisfaction Survey Template | Medium 🔄, multi-question, timed delivery | Medium ⚡, integration with order/shipping systems | Medium–High ⭐📊, full-journey satisfaction and testimonial capture | eCommerce, subscription, DTC brands, post-delivery checks | Balances depth and response rates; captures product-market fit |
| Customer Effort Score (CES) + Open Feedback Hybrid Template | Medium 🔄, CES plus conditional follow-ups | Medium ⚡, conditional logic; needs text analysis | High ⭐📊, predictive + diagnostic insights with context | SaaS onboarding, support resolution, checkout optimization | Fast + actionable: friction score + qualitative causes |
| Transactional or Moment-in-Time Survey Template | Medium–High 🔄, event triggers and micro-surveys | Medium–High ⚡, requires event-driven integrations | High ⭐📊, strongest behavioral correlation, rapid feedback | Feature first-use, ticket resolution, post-purchase moments | Highest response rates; enables real-time product/support fixes |
| 360-Degree Customer Health Scorecard Template | Very high 🔄, multi-source aggregation, weighting | Very high ⚡, cross-team integration, analytics expertise | Very High ⭐📊, predictive churn/expansion score for accounts | Enterprise SaaS, RevOps, CSMs, renewal strategy | Holistic account health; single score to drive interventions |
From Data to Decisions Activating Your Feedback
The survey is not the program. The program is what happens next.
Teams usually know they should collect feedback. The harder part is making the feedback operational. A good survey stack routes low scores to recovery, sends high scores into advocacy, tags themes by journey stage, and gives product, support, and CX leaders a way to see patterns without reading every response manually. That's the difference between running customer satisfaction survey examples as content exercises and running them as part of revenue and retention operations.
The metric you choose should follow the decision you need to make. Use NPS when you need a clean read on loyalty and relationship health. Use CSAT when you need to understand a discrete interaction. Use CES when you're diagnosing friction. Use a multi-dimensional survey when one score is hiding too much. Use a health scorecard when the account is too important for a single metric to tell the truth.
The implementation details matter just as much. Keep the first question easy. Use conditional logic so respondents only see relevant follow-ups. Capture context automatically when you can, such as product tier, order type, support queue, or lifecycle stage. Route responses into systems people already work in, whether that's Slack, a CRM, a support platform, or a success dashboard. If the insight lives in a separate folder nobody checks, it won't change behavior.
Mobile design deserves special attention. Survey programs still fail because they assume respondents will tolerate dense, desktop-style forms. They won't. If the experience is clumsy, customers abandon before they explain what went wrong. Shorter paths, adaptive follow-ups, and partial submission tracking make a big difference in what your team learns.
This is also where a tool like BuildForm can fit naturally. It supports adaptive logic, partial submission tracking, and integrations that make it easier to move from response capture into action. That's useful for SaaS startups and ecommerce teams that want feedback inside the same operating flow as lead capture, customer communication, and conversion tracking.
If you're building a broader CX system, surveys should tie into bigger retention work, including how you improve customer retention rates. A low score is rarely just a survey issue. It usually points to a broken handoff, a confusing step, or a mismatch between promise and delivery.
Start with one survey tied to one business goal. If onboarding friction is the issue, launch CES. If support quality is under scrutiny, launch CSAT. If renewals feel unpredictable, launch NPS or a health scorecard. Then do the hard part. Route it, review it, and act on it while the response still matters.
If you want to put these survey patterns into practice, BuildForm gives teams a practical way to create adaptive feedback flows, capture partial responses, and connect survey data to the tools where follow-up happens.